
Videos
Refer to Exercise 13 in Section 9.1.
- a. Use the Bonferroni method to determine which pairs of
means , if any, are different at the 5% level. - b. Use the Tukey-Kramer method to determine which pairs of means, if any, are different at the 5% level.
- c. Which is the more powerful method to find all the pairs of treatments whose means are different, the Bonferroni method or the Tukey–Kramer method?
a.
Compare the pairs of treatments and conclude that any of the mean temperatures are different at 5% level of significance level of significance using Bonferroni method.
Answer to Problem 5E
The conclusion is that the mean temperature of
The mean temperature of
Explanation of Solution
Calculation:
The given information is based on conducting experiment on tensile strength of iron. A sample of 5 specimens with four temperatures has been taken to test its tensile strength.
The aim is to compare the means of temperatures.
Bonferroni method for the comparison of multiple means:
Comparison of two means:
The mean effects of the ith and jth groups are considered to be significantly different, if the following condition is satisfied:
Where,
Where, N is the sample size, C be the number of pairs of difference to compare such that
The value of C is:
Substitute
The number of pairs to compare is 6.
The critical value at 5% level of significance is:
Substitute
Software procedure:
Step by step procedure to obtain the critical-value using the MINITAB software is given below:
- Choose Graph > Probability Distribution Plot choose View Probability> OK.
- From Distribution, choose ‘t’ distribution.
- Enter Degrees of freedom as 16.
- Click the Shaded Area tab.
- Choose P Value and Right Tail for the region of the curve to shade.
- Enter the data value as 0.004167.
- Click OK.
Output using the MINITAB software is given below:
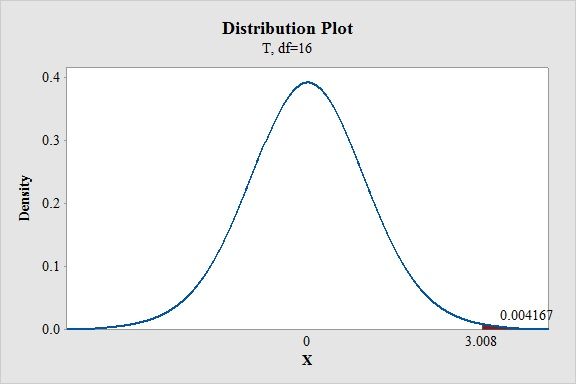
From the MINITAB output, the value of
From the Exercise 13 in section 9.1, the value of MSE is 2.30.
The value of
Substitute the
Descriptive measures of temperatures:
Software procedure:
Step by step procedure to obtain the descriptive measures using the MINITAB software is given below:
- Choose Stat > Basic Statistics > Display Descriptive Statistics.
- In Variables enter the columns
- Choose option statistics, and select N total and Mean.
- Click OK.
Output obtained using MINITAB is given below:
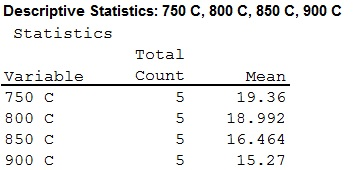
From the MINITAB, the mean value of
Compare the means of
State the hypotheses:
Null hypothesis:
That is, there is no significant difference between the mean effects of ith and jth treatments.
Alternative hypothesis:
That is, there is significant difference between the mean effects of ith and jth treatments.
Substitute
It has been found that the difference of mean
Thus, the means of the
Compare the means of
Substitute
It has been found that the difference of mean
Thus, the means of the
Compare the means of
Substitute
It has been found that the difference of mean
Thus, the means of the
Compare the means of
Substitute
It has been found that the difference of mean
Thus, the mean of the
Compare the means of
Substitute
It has been found that the difference of mean
Thus, the means of the
Compare the means of
Substitute
It has been found that the difference of mean
Thus, the means of the
Thus, by comparing the mean temperature of
Hence it is clear that the mean temperature of
b.
Compare the pairs of treatments and conclude that any of the mean temperatures are different at 5% level of significance level of significance using Tukey-Kramer method.
Answer to Problem 5E
The conclusion is that the mean temperature of
The mean temperature of
Explanation of Solution
Calculation:
The aim is to compare the means of temperature.
Tukey-Kramer method for the comparison of multiple means:
Comparison of two means:
The mean effects of the ith and jth groups are considered to be significantly different, if the following condition is satisfied:
Where, N is the sample size, I denotes the number of treatments,
The studentized range value at 5% level of significance is:
Substitute
Use Table A.9: upper percentage points for the studentized range value.
Procedure:
For
- Locate
- Locate
- Obtain the value in the corresponding row below 0.05.
That is,
From the Exercise 13 in section 9.1, the value of MSE is 2.30.
The value of
Substitute the
From the previous part (a), the mean value of
Compare the means of
Substitute
It has been found that the difference of mean
Thus, the means of the
Compare the means of
Substitute
It has been found that the difference of mean
Thus, the means of the
Compare the means of
Substitute
It has been found that the difference of mean
Thus, the means of the
Compare the means of
Substitute
It has been found that the difference of mean
Thus, the means of the
Compare the means of
Substitute
It has been found that the difference of mean
Thus, the means of the
Compare the means of
Substitute
It has been found that the difference of mean
Thus, the means of the
Thus, by comparing the mean temperature of
Hence it is clear that the mean temperature of
c.
Identify the more powerful method among the Bonferroni method and Tukey-Kramer method.
Answer to Problem 5E
The Tukey-Kramer method is more powerful than the Bonferroni method.
Explanation of Solution
Interpretation:
Condition for more powerful method of multiple comparisons:
The method of multiple comparisons, which has a smaller critical value for a given dataset, is the more powerful method of multiple comparisons for that particular dataset.
From the previous parts (a) and (b), the critical value of the Bonferroni method at 5% level of significance is 2.885 and the critical value of the Tukey-Kramer method at 5% level of significance is 2.75.
Therefore, the critical value of Tukey-Kramer method holds the minimum critical value and it is said to be more powerful than the Bonferroni method.
Want to see more full solutions like this?
Chapter 9 Solutions
EBK STATISTICS FOR ENGINEERS AND SCIENT
Additional Math Textbook Solutions
Elementary Statistics Using The Ti-83/84 Plus Calculator, Books A La Carte Edition (5th Edition)
Statistics for Psychology
Elementary Statistics Using Excel (6th Edition)
Statistics for Business and Economics (13th Edition)
Elementary Statistics
Statistics: The Art and Science of Learning from Data (4th Edition)


- Cholesterol Cholesterol in human blood is necessary, but too much can lead to health problems. There are three main types of cholesterol: HDL (high-density lipoproteins), LDL (low-density lipoproteins), and VLDL (very low-density lipoproteins). HDL is considered “good” cholesterol; LDL and VLDL are considered “bad” cholesterol. A standard fasting cholesterol blood test measures total cholesterol, HDL cholesterol, and triglycerides. These numbers are used to estimate LDL and VLDL, which are difficult to measure directly. Your doctor recommends that your combined LDL/VLDL cholesterol level be less than 130 milligrams per deciliter, your HDL cholesterol level be at least 60 milligrams per deciliter, and your total cholesterol level be no more than 200 milligrams per deciliter. (a) Write a system of linear inequalities for the recommended cholesterol levels. Let x represent the HDL cholesterol level, and let y represent the combined LDL VLDL cholesterol level. (b) Graph the system of inequalities from part (a). Label any vertices of the solution region. (c) Is the following set of cholesterol levels within the recommendations? Explain. LDL/VLDL: 120 milligrams per deciliter HDL: 90 milligrams per deciliter Total: 210 milligrams per deciliter (d) Give an example of cholesterol levels in which the LDL/VLDL cholesterol level is too high but the HDL cholesterol level is acceptable. (e) Another recommendation is that the ratio of total cholesterol to HDL cholesterol be less than 4 (that is, less than 4 to 1). Identify a point in the solution region from part (b) that meets this recommendation, and explain why it meets the recommendation.arrow_forwardnot A 1995 study by the School of Public Health reported that 87% of male students who live in a fraterity house are binge drinkers. The figure for fraternity members who are residents of a fraternity house is 71 %, while the figure for men who do not belong to a fraternity is 44 % Suppose that 11% of U.S. male students live in a fraternity house, 15% belong to a fraterity but do not live in a fraterity house, and 74% do not belong to a fraterity a. What is the probability that a randomly selected malp student is a binge drinker? b. If a randomly selected male student is a binge drinker, what is the probability that he lives in a fraterity house? The probability that a randomly selected male student is a binge drinker is 0.5509 (Type an integer or a decimal rounded to two decimal places as needed) CETTEarrow_forwardPlant X manufactures 70 percent of a certain company's bicycles, and Plant Y manufactures 30 percent. It has been found that 4 percent of the bicycles manufactured at Plant X and 5 percent of the bicycles manufactured at Plant Y are defective. What percent of the bicycles manufactured by the company are not defective? O 87.2% O 91.3% O 95.5% O 95.7%arrow_forward
- 1. During the second quarter, market share for streaming services were recorded as Hulu - 22%, Netflix - 59%, and Amazon Prime - 19%. A sample of 600 users yielded the following viewing audience data. We want to determine whether or not there has been a significant change in the market share of the streaming services. Using α=0.05, perform the test. Number of users p1 ei Hulu 150 0.22 33 Netflix 366 0.59 80.52 Amazon Prime 84 0.19 18.48arrow_forwardAn aircraft emergency locator transmitter (ELT) is a device designed to transmit a signal in the case of a crash. The Altigauge Manufacturing Company makes 80% of the ELTS, the Bryant Company makes 15% of them, and the Chartair Company makes the other 5%. The ELTS made by Altigauge have a 4% rate of defects, the Bryant ELTS have a 6% rate of defects, and the Chartair ELTS have a 9% rate of defects (which helps to explain why Chartair has the lowest market share). i) If an ELT is randomly selected from the general population of all ELTS, find the probability that it was made by the Altigauge Manufacturing Company. If a randomly selected ELT is then tested and is found to be ii) defective, find the probability that it was made by the Altigauge Manufacturing Company.arrow_forwardSC Español The owner of a chain of mini-markets wants to compare the sales performance of two of her stores, Store 1 and Store 2. Sales can vary considerably depending on the day of the week and the season of the year, so she decides to eliminate such effects by making sure to record each store's sales on the same 8 days, chosen at random. She records the sales (in dollars) for each store on these days, as shown in the table below. Day 1 2 3 4 5 6 7 8 Store 1 878 511 837 835 755 241 713 443 D Store 2 685 412 785 763 480 173 639 287 Difference (Store 1 - Store 2) 193 99 52 72 275 68 74 156 Send data to calculator V Based on these data, can the owner conclude, at the 0.05 level of significance, that the mean daily sales of the two stores differ? Answer this question by performing a hypothesis test regarding μ (which is u with a letter "d" subscript), the population mean daily sales difference between the two stores. Assume that this population of differences (Store 1 minus Store 2) is…arrow_forward
- An aircraft emergency locator transmitter (ELT) is a device designed to transmit a signal in the case of a crash. The Altigauge Manufacturing Company makes 80% of the ELTS, the Bryant Company makes 15% of them, and the Chartair Company makes the other 5%. The ELTS made by Altigauge have a 4% rate of defects, the Bryant ELTS have a 6% rate of defects, and the Chartair ELTS have a 9% rate of defects (which helps to explain why Chartair has the lowest market share). a. If an ELT is randomly selected from the general population of all ELTS, find the probability that it was made by the Altigauge Manufacturing Company. b. If a randomly selected ELT is then tested and is found to be defective, find the probability that it was made by the Altigauge Manufacturing Company. c. What is the probablity that a randomly selected ELT is defective?arrow_forwardThe mayor of a town has proposed a plan for the construction of an adjoining bridge. A political study took a sample of 900 voters in the town and found that 48% of the residents favored construction. Using the data, a political strategist wants to test the claim that the percentage of residents who favor construction is not equal to 51%. Testing at the 0.05 level, is there enough evidence to support the strategist's claim? Step 1 of 6 : State the null and alternative hypotheses.arrow_forwardSamuel recently got his first dog, and he's considering if he should pay for professional dog training. He's skeptical paying for this training is worth it, but fortunately Samuel is a statistician and friends with some researchers at the veterinary school. They randomly recruit 70 dogs to take part in the study, and a respected pet trainer in the region agrees to help train these dogs as part of the study. Prior to the study, Samuel and the vets pair off all the dogs based on both biological characteristics as well as owner characteristics. As a result, they have 35 pairs of dogs that are relatively similar. One dog in each pair is randomly chosen to receive the professional behavior training, while the other dog will not receive the training (but will still be trained by its owners). After training the dogs for two months, a second professional dog trainer is brought in to assess the obedience levels of all the dogs. Assume they are able to do so and can convert their ratings to a…arrow_forward
- The mayor of a town has proposed a plan for the construction of an adjoining community. A political study took a sample of 800 voters in the town and found that 70% of the residents favored construction. Using the data, a political strategist wants to test the claim that the percentage of residents who favor construction is not equal to 73%. Testing at the 0.01 level, is there enough evidence to support the strategist's claim? Step 4 of 6 : Determine the decision rule for rejecting the null hypothesis, H0H0.arrow_forwardYou have a large vegetable garden that has beefsteak tomato plants. Bees account for close to 80% of pollination of fruits, vegetables, and seed crops. You want more bees to visit your garden because more pollination means more tomatoes. Research has shown that bees prefer flowers that are either yellow, white, or blue; however, they are not attracted to red flowers because they see red as an absence of color. You are curious to see if this is true. In your garden, you separate two environmentally similar spaces for your beefsteak tomato plants. In one of the areas, you add yellow flowers around the tomato plants; in the other area you add red flowers. A random sample of 15 tomato plants surrounded by yellow flowers was taken and the mean tomato yield weight was 12.4 pounds per plant with a standard deviation of 2.7. Another random sample of 16 tomato plants that were surrounded by red flowers showed a mean tomato yield weight of 11.5 pounds per plant with a standard deviation of 2.1.…arrow_forwardIn 2003 and 2017 a poll asked Democratic voters about their views on the FBI. In 2003, 45% thought the FBI did a good or excellent job. In 2017, 74% of Democratic voters felt this way. Assume these percentages are based on samples of 1300 Democratic voters. Complete parts (a) through (d) below. a. Can we conclude, on the basis of these two percentages alone, that the proportion of Democratic voters who think the FBI is doing a good or excellent job has increased from 2003 to 2017? Why or why not? A. No. Although a lesser percentage is present in the sample, the population percentages could be the same or even reversed. B. No. Although a lesser percentage is present in the sample, the population percentages could be the same, but could not be reversed. C. No. Since a greater percentage is present in the sample, we cannot conclude that a lesser percentage of Democratic voters who think the FBI is doing a good or excellent job is present in the population. D. Yes. Since a lesser…arrow_forward
 Big Ideas Math A Bridge To Success Algebra 1: Stu...AlgebraISBN:9781680331141Author:HOUGHTON MIFFLIN HARCOURTPublisher:Houghton Mifflin Harcourt