
Concept explainers
Videos
Refer to Example 8.6. The political action group was interested in determining regional differences in the public’s opinion concerning air pollution. Write a contrast in the four population means to answer each of the following questions.
- a. Question 1: Is the proportion of people who thought the EPA’s standards are not stringent enough different for the people living in the East compared to the people living in the West?
- b. Question 2: Is the proportion of people who thought the EPA’s standards are not stringent enough different for the people living in the Northeast compared to the people living in the other three regions?
- c. Question 3: Is the proportion of people who thought the EPA’s standards are not stringent enough different for the people living in the Northeast compared to the people living in the Southeast?
- d. Simultaneously test if the three contrasts are different from 0 using an α = .05 test.
- e. Are the three contrasts mutually orthogonal?
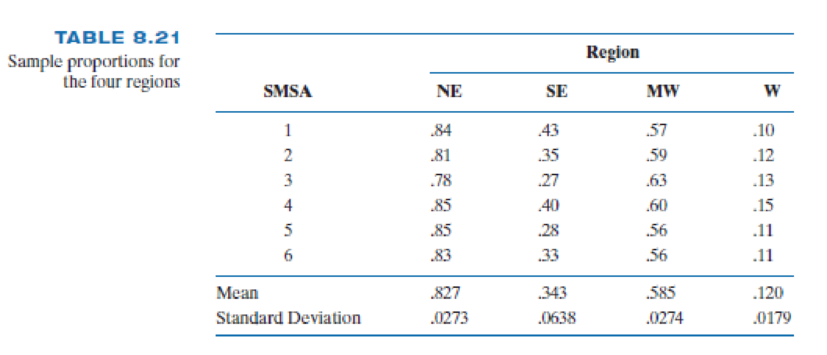
EXAMPLE 8.6
A political action group conducted a national opinion poll to evaluate the voting public’s opinion concerning whether the new EPA regulations on air pollution were stringent enough to protect the public’s health. The group was also interested in determining if there were regional differences in the public’s opinion concerning air pollution. For this poll, the country was divided into four geographical regions (NE, SE, MW, W). A random sample of 100 registered voters was obtained from each of six standard metropolitan statistical areas (SMSAs) located in each of the four regions. The data in Table 8.21 are the sample proportions,
- a. Is there a significant difference in the variability of the four region’s proportion? Use α = .05.
- b. Transform the data using
- c. Compute the sample means and sample standard deviations for the transformed data. Did the transformation yield a stabilization of the variances?
Want to see the full answer?
Check out a sample textbook solution
Chapter 9 Solutions
An Introduction to Statistical Methods and Data Analysis


 Glencoe Algebra 1, Student Edition, 9780079039897...AlgebraISBN:9780079039897Author:CarterPublisher:McGraw Hill
 Holt Mcdougal Larson Pre-algebra: Student Edition...AlgebraISBN:9780547587776Author:HOLT MCDOUGALPublisher:HOLT MCDOUGAL
 Big Ideas Math A Bridge To Success Algebra 1: Stu...AlgebraISBN:9781680331141Author:HOUGHTON MIFFLIN HARCOURTPublisher:Houghton Mifflin Harcourt