
a.
The
a.
Answer to Problem 9.7P
The equilibrium price is $400, producer surplus is $20,000 and consumer surplus is $16,000.
Explanation of Solution
The demand for the broccoli is given by,
Equilibrium is a point where the demand and supply curve meet. Hence this point will be,
Hence the equilibrium price is $120. Now substitute this value in above equation, we get,
Hence the equilibrium quantity is 400 units. Now the total expenditure is calculated as follows,
Now the consumer surplus is calculated by as follows,
Hence the consumer surplus is $16,000.
Now the producer surplus is calculated below,
Hence, the producer surplus is $20,000.
Introduction:Consumer surplus is a difference between the amount which consumer actually pays and the amount which he is willing to pay.
Producer surplus is the difference between what the consumer is willing to accept for a given quantity of money or good and the how much a person actually receives by selling the good in the market at the prevailing prices.
b
To describe: The total loss in consumer surplus and producer surplus, provided some values are changed.
b
Answer to Problem 9.7P
Hence the new consumer surplus is $12,000 and new producer surplus is $15,000.
Explanation of Solution
Suppose Q= 300, the total consumer surplus is calculated as follows,
=
Thus the new consumer surplus is $12,000 and it is decreased by the amount of $4,000. Now the producer surplus is calculated by as follows,
Thus the new producer surplus is $15,000 and it is decreased by the amount of $5,000.
Introduction: Consumer surplus is a difference between the amount which consumer actually pays and the amount which he is willing to pay.
Producer surplus is the difference between what the consumer is willing to accept for a given quantity of money or good and the how much a person actually receives by selling the good in the market at the prevailing prices.
c.
To describe: The allocation of producer and consumer surplus between suppliers and demanders are dependent upon the price at which broccoli is sold.
c.
Answer to Problem 9.7P
As the equilibrium price increases, consumer surplus will decreased by $7,000 and producer surplus will increased by $8,800. If price will be $95 then producer surplus is decreased by $8,750 and consumer surplus is decreased by $11,562.50.
Explanation of Solution
Let the equilibrium price P = $140, then consumer surplus is calculated as follows,
As the equilibrium price is increased, the consumer surplus will decreased by $7,000.
Now the producer surplus will be,
As the equilibrium price is increased, producer surplus will increased by $8,800.
Now assume the equilibrium price is $95 then the consumer surplus will be,
Thus consumer surplus is decreased by $11,562.50. Now the producer surplus will be,
Thus, the producer surplus is decreased by $8,750.
Introduction: Consumer surplus is the difference between the amount a consumer spends to purchase a commodity versus the amount he willingly wants to spend on the purchase.
Producer surplus is the difference between what the consumervoluntarily want to accept for a particular amount quantity of money or quantity of good and how much a person actually generates by selling the good in the market at the existing prices.
d.
To describe: The total loss of
d.
Answer to Problem 9.7P
Thus the consumer surplus is increased by $2,000 and producer surplus is increased by $2,500.
Explanation of Solution
Let
Thus the consumer surplus is increased by $2,000. Now calculate the producer surplus,
Thus the producer surplus is increased by $2,500.
Introduction: Equilibriumpoint is that point at which demand and supply curve cut each other. At equilibrium quantity demanded is always equal to quantity supplied.
e.
To describe: The graph of results.
e.
Answer to Problem 9.7P
The graphs of all the results are given below.
Explanation of Solution
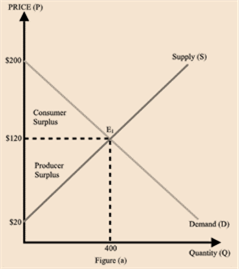
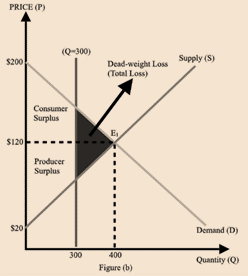
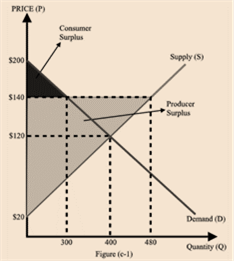
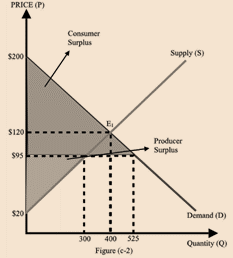
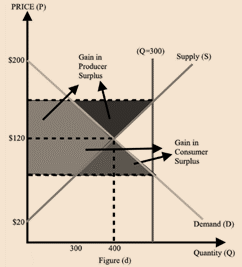
Here, the price shows in Y-axis and quantity shows in X-axis. Here fig (a) shows the equilibrium point at 400 and the equilibrium price is $120. The fig (b) shows that the equilibrium price is reduced to 300 from 400. The blue area shows the loss. The fig (c) shows the variation in equilibrium price from $120 to $95. The fig(d) represents the increased quantity from 300 to 450.
Introduction: Consumer surplus is a difference between the amount which consumer actually pays and the amount which he is willing to pay.
Producer surplus is the difference between what the consumer is willing to accept for a given quantity of money or good and the how much a person actually receives by selling the good in the market at the prevailing prices.
Want to see more full solutions like this?
Chapter 9 Solutions
EBK INTERMEDIATE MICROECONOMICS AND ITS

- Assuming an increase in Demant and decrease in Supply, which of the following statements is TRUE? The price of the good will decrease. The quantity of the good will definitely decrease. The price of this good will definitely increase. There will be a permanent shortage of this good. The new equilibrium quantity may increase, decrease, or stay the same. A surplus of this good will result from these changes in Supply and Demand. What new equiLibrium quantity will result depends on the relative magnitude of the changes and the shapes of the Demand and Supply curves. We cannot determine what will happen to price.arrow_forwardHow much is total producer surplus in this market at the equilibrium price?arrow_forwardConsider the market for hamburgers in Dallas, where there are over a thousand burger joints at any given moment. Suppose an innovation in meat processing technology makes it possible to produce more hamburgers at a lower cost than ever before.arrow_forward
- Using a supply and demand graph, show the market for plain cheese pizza in equilibrium. Label the point of market equilibrium point E, equilibrium price P∗ as $20 and equilibrium quantity Q∗ as 140. And be sure to label the axes and curves!arrow_forwardThe graph below represents the supply of Good X. The numbers on the chart show the percent changes in price and quantity moving along the supply curve. The numbers below the horizontal lines indicate the percent change in quantity, while the numbers to the right of the vertical lines indicate the percent change in price. Which portion of the supply curve for Good A is unitary elastic? Select the correct answer below: Point A to Point B Point B to Point C Point C to Point D Point D to Point Earrow_forwardWhat happens in the graph when the price of bottled water rises? What happens when the price of flavored water( a subsistute in production for bottled water) rises? When the price of bottled water rises, _____. When the price of flavored water rises, ____.? A. There is a movement along the supply curve; the supply curve shifts rightward. B. The supply curve shifts leftward; there is a movement down along the supply curve. C. The supply curve shifts rightward; there is a movement up along the supply curve. D. there is a movement up along the supply curve; the supply curve shifts leftward.arrow_forward
- Suppose that the demand for broccoli is given by: Q=1000-5P where Q is quantity per year measured in hundreds of bushels and P is the price in dollars per hundred bushels. The long-run supply curve for broccoli is given by: Q=4P-80 Show that the equilibrium quantity here is Q= 400. At this output, what is the equilibrium price? How much in total is spent on broccoli? What is consumer surplus at this equilibrium? What is producer surplus at this equilibrium? How much in total consumer and producer surplus would be lost if Q= 300 instead of Q= 400? Show how the allocation between suppliers and demanders of the loss of total consumer and producer surplus described in part (b) depends on the price at which broccoli is sold. How would the loss be shared if P= 140? How about if P= 95? What would be the total loss of consumer and producer surplus if Q= 450 rather than Q= 400? Show that the size of this total loss also is independent of the price at which the broccoli is sold. Now suppose the…arrow_forwardEarlier this year it was reported that the supply of avocados(鳄梨) has fallen because of weather conditions. “…this time last year 360,000 trays were being produced per week, but that figure has fallen below 100,000 trays in recent weeks”. What information would you need about the market for avocadoes to assess whether growers of avocadoes as a group were hurt or helped by these poor weather conditions? Explain. If the demand for avocados is less price elastic than the supply of avocados, what short term impact would this have on the price of avocados (include a graph to help demonstrate your answer)arrow_forwardYour research department estimates that the supply function for high definition televisions (HDTVs) is given by Qxs = 2,000 + 3 Px − 4 Pt − Pw where Px is the price of HDTVs, Pt represents the price of a tablet, and Pw is the price of an input used to make HDTVs. Suppose HDTVs are sold for $400 per unit, tablets are sold for $250 per unit, and the price of an input is $1,400. How many HDTVs are produced?arrow_forward
- The equilibrium price and the quantity of a good sold in the market are determined by the forces of demand and supply. Equilibrium occurs at the point where the quantity demanded is equal to the quantity supplied.arrow_forwardUsing both words and graphs, determine what would happen in the market for hamburgers made of beef if: A- The price of hot dogs (made of Turkey) increases B- A disease develops that kills a large proportion of cattle of cows C- A new breed of cattle of cows is developed with much faster growth D- Medical research proves that cattle of cows results in hamburgers with less cholesterol than hamburgers from sheep E- direct subsidy on each head of cattle is given to farmers raising cattle. Note:- Do not provide handwritten solution. Maintain accuracy and quality in your answer. Take care of plagiarism. Answer completely. You will get up vote for sure.arrow_forwardUsing both words and graphs, determine what would happen in the market for hamburgers made of beef if: A- The price of hot dogs (made of Turkey) increases B- A disease develops that kills a large proportion of cattle of cows C- A new breed of cattle of cows is developed with much faster growth D- Medical research proves that cattle of cows results in hamburgers with less cholesterol than hamburgers from sheep E- direct subsidy on each head of cattle is given to farmers raising cattle.arrow_forward
 Managerial Economics: A Problem Solving ApproachEconomicsISBN:9781337106665Author:Luke M. Froeb, Brian T. McCann, Michael R. Ward, Mike ShorPublisher:Cengage Learning

 Economics (MindTap Course List)EconomicsISBN:9781337617383Author:Roger A. ArnoldPublisher:Cengage Learning
