Concept explainers
Find the total stress
Answer to Problem 9.1P
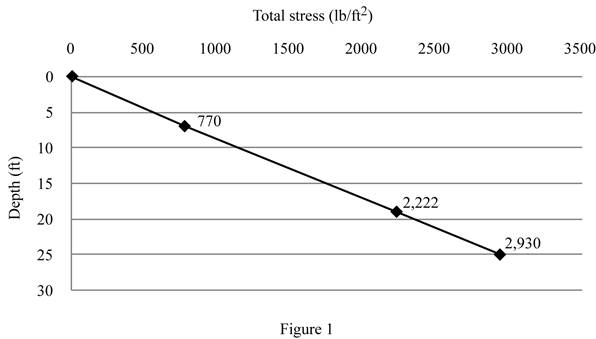
The total stress at point A is
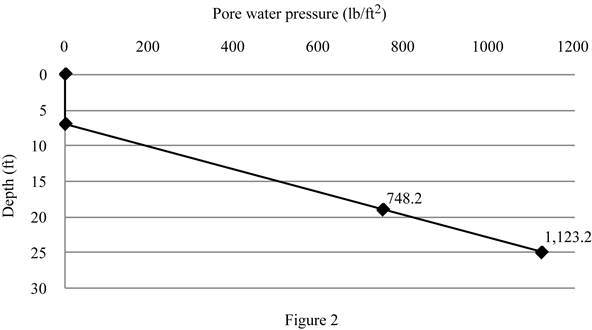
The pore water pressure at point A is
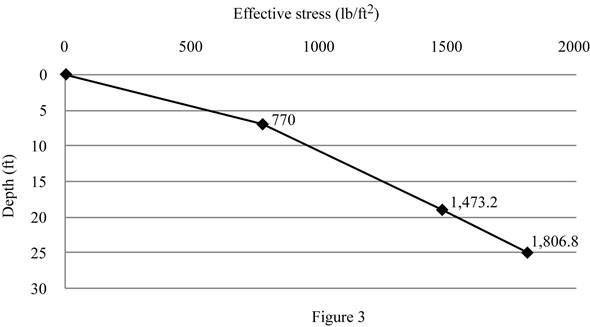
The effective stress at point A is
The total stress at point B is
The pore water pressure at point B is
The effective stress at point B is
The total stress at point C is
The pore water pressure at point C is
The effective stress at point C is
The total stress at point D is
The pore water pressure at point D is
The effective stress at point D is
Explanation of Solution
Given information:
The thickness
The thickness
The thickness
The dry unit weight
The saturated unit weight
The saturated unit weight
Calculation:
Calculate the total stress at point A (0 ft).
Thus, the total stress at point A is
Calculate the pore water pressure at point A (0 ft).
Thus, pore water pressure at point A is
Calculate the effective stress at point A (0 ft) using the relation.
Substitute 0 for
Thus, effective stress at point A is
Calculate the total stress at point B (7 ft) using the relation.
Substitute
Thus, total stress at point B is
Calculate the pore water at point B (7 ft) using the relation.
Thus, the pore water pressure at point B is
Calculate the effective stress at point B (7 ft) using the relation.
Substitute
Thus, the effective stress at point B is
Calculate the total stress at point C (19 ft) using the relation.
Substitute
Thus, the total stress at point C is
Calculate the pore water pressure at point C (19 ft) using the relation.
Here,
Take the unit weight of the water as
Substitute
Thus, the pore water pressure at point C is
Calculate the effective stress at point C (19 ft) using the relation.
Substitute
Thus, the effective stress at point C is
Calculate the total stress at point D (25 ft) using the relation.
Substitute
Thus, the total stress at point D is
Calculate the pore water pressure at point D (25 ft) using the relation.
Substitute
Thus, the pore water pressure at point D is
Calculate the effective stress at point D (25 ft) using the relation.
Substitute
Thus, the effective stress at point D is
Show the plot between depth and total stress as in Figure 1.

Show the plot between depth and pore water pressure as in Figure 2.

Show the plot between depth and effective stress as in Figure 3.

Want to see more full solutions like this?
Chapter 9 Solutions
Principles of Geotechnical Engineering (MindTap Course List)
- P.3.4 A mercury U-tube manometer is used to measure the pressure drop across an orifice in pipe. If the liquid that flowing through the orifice is brine of sp.gr. 1.26 and upstream pressure is 2 psig and the downstream pressure is (10 in Hg) vacuum, find the reading of manometer. Ans. R=394 mm Hgarrow_forwardProject management questionarrow_forwardQ5/B with Explantion plsarrow_forward
- project management question Q5/Barrow_forwardProblem 1: Given: In a given floor system, a 5-in concrete slab supported by T-beams of 24-ft spans, supporting 354 psf live load. The T-beams are spaced 2x4 ft on center, and bw (width of the beam web) = 15 inches. Total T-beam height is 25 inches. f'c = 4,000psi, fy = 60,000psi. Design the T-beam. Show all steps. Sketch your Design. Problem 2: Given: A 25"x25" column is subject to a factored axial load of Pu=1,200 kips, and factored design moment of Mu-354 kips-ft. f'c 4,000psi, fy = 60,000psi. Determine the required steel ratio (p) and ties. Sketch the design. 2.0 0.08 INTERACTION DIAGRAM R4-60.9 fc-4 ksi 1.8 1,- 60 ksi 0.07 Y=0.9 16 1.6 0.06 Kmax 0.05 1.4 f/f, = 0 0.04 00 K₁ = P₁/f'c Ag 1.2 12 0.03 0.25 1.0 10 0.02 0.01 0.8 0.6 0.4 €,= 0.0035 0.2 €,= 0.0050 0.0 h yh 0.50 0.75 1.0. 0.00 0.05 0.10 0.15 0.20 0.25 0.30 0.35 0.40 0.45 0.50 R₁ = P₁e/f'Agharrow_forwardGiven: In a given floor system, a 5-in concrete slab supported by T-beams of 24-ft spans, supporting 354 psf live load. The T-beams are spaced 2x4 ft on center, and bw (width of the beam web) = 15 inches. Total T-beam height is 25 inches. f'c = 4,000psi, fy = 60,000psi. Design the T-beam. Show all steps. Sketch your Design.arrow_forward
- Problem 2: Given: A 25"x25" column is subject to a factored axial load of Pu=1,200 kips, and factored design moment of Mu-354 kips-ft. f'c 4,000psi, fy = 60,000psi. Determine the required steel ratio (p) and ties. Sketch the design. 2.0 P=0.08 INTERACTION DIAGRAM R4-60.9 fc-4 ksi 1.8 1,- 60 ksi 0.07 7=0.9 1.6 16 0.06 Kmax 0.05 1.4 f/f, = 0 0.04 90 K₁ = P₁/f'Ag 1.2 0.03 0.25 0.02 1.0 0.01 0.8 0.6 0.4 €= 0.0035 0.2 €,= 0.0050 0.0 h yh 0.50 0.75 1.0. 0.00 0.05 0.10 0.15 0.20 0.25 0.30 0.35 0.40 0.45 0.50 R₁ = P₁e/f'Aharrow_forwardGiven: A 25"x25" column is subject to a factored axial load of Pu=1,200 kips, and factored design moment of Mu=354 kips-ft. f'c 4,000psi, fy = 60,000psi. Determine the required steel ratio () and ties. Sketch the design.arrow_forwardSee Figure (1) below. A 14 in. wide and 2 in. thick plate subject to tensile loading has staggered holes as shown. Compute An and Ae. P 2.00 3.00 4.00 3.00 2.00 ΕΙ T A B C F G D S = 2.50 3/4" bolts in 13/16" holes 14x12 PL Parrow_forward
 Fundamentals of Geotechnical Engineering (MindTap...Civil EngineeringISBN:9781305635180Author:Braja M. Das, Nagaratnam SivakuganPublisher:Cengage Learning
 Principles of Geotechnical Engineering (MindTap C...Civil EngineeringISBN:9781305970939Author:Braja M. Das, Khaled SobhanPublisher:Cengage Learning

