Concept explainers
(a)
To create a
(a)
Explanation of Solution
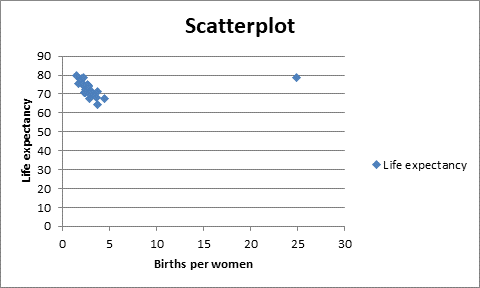
The data from the World Bank for the western hemisphere countries is used to examine the association between female life expectancy and the average number of children women gave birth to. The data is as given in the question. The scatterplot for the female life expectancy versus the number of children women give birth to is as:

The births per women is on the horizontal axis and the life expectancy is on the vertical axis. By looking at the scatterplot, we find out that expect for the outlier for the country Costa Rica, the remaining data appears to have a linear form in a negative direction.
(b)
To explain are there any countries that do not seem to fit the overall pattern.
(b)
Answer to Problem 31E
The country Costa Rica do not seem to fit the overall pattern.
Explanation of Solution
The data from the World Bank for the western hemisphere countries is used to examine the association between female life expectancy and the average number of children women gave birth to. We have to find out are there any countries that do not seem to fit the overall pattern. For this by looking at the scatterplot we found that in the right hand corner there is an outlier that does not fit the rest of the data. Thus, the country Costa Rica, whose data appear to be wrong with
(c)
To find the
(c)
Answer to Problem 31E
The correlation of the data is
Explanation of Solution
The data from the World Bank for the western hemisphere countries is used to examine the association between female life expectancy and the average number of children women gave birth to.To find the value of correlation, we will use the excel. Now,
The data given in the question is:
| Births per Women | Life expectancy |
| 2.3 | 74.6 |
| 2.3 | 70.5 |
| 1.7 | 75.4 |
| 3 | 71.9 |
| 3.7 | 64.5 |
| 2.3 | 70.9 |
| 1.5 | 79.8 |
| 2 | 78 |
| 2.4 | 72.6 |
| 24.9 | 78.7 |
| 2.8 | 67.8 |
| 2.7 | 74.5 |
| 2.8 | 71.1 |
| 4.4 | 67.6 |
| 3.6 | 68.2 |
| 2.4 | 70.8 |
| 2.2 | 75.1 |
| 3.2 | 70.1 |
| 2.6 | 75.1 |
| 3.7 | 71.2 |
| 2.8 | 70.4 |
| 1.9 | 77.5 |
| 2 | 77.4 |
| 2.1 | 75.2 |
| 2.7 | 73.7 |
| 2.2 | 78.6 |
Formula used:
The CORREL
CORREL(array
Calculation:
The function is used for the data and the result will be:
| Correlation | =CORREL(AD81:AD106,AE81:AE106) |
Then by this formula we will get the result as:
| Correlation | 0.1682 |
Thus the correlation of the data is
Now, the value of
Thus, we have that the value of
The function is used for the data and the result will be:
| Correlation | =CORREL(AD81:AD105,AE81:AE105) |
Then by this formula we will get the result as:
| Correlation | -0.796 |
Thus the correlation of the data is
Now, the value of
Thus, without Costa Rica, the value of
(d)
To find the equation of the regression line.
(d)
Answer to Problem 31E
Explanation of Solution
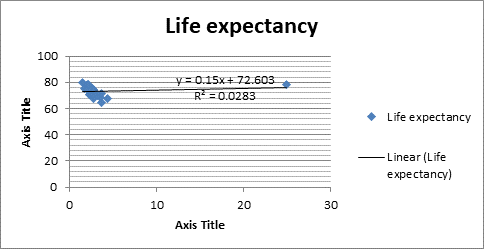
The data from the World Bank for the western hemisphere countries is used to examine the association between female life expectancy and the average number of children women gave birth to. Thus, by the scatterplot we have the regression line for the data of life expectancy and the births per women. Therefore, the scatterplot by excel we have:

Here the regression line is mentioned in the plot, which is:
(e)
To explain is the line an appropriate model or not and describe what you see in the residual plot.
(e)
Answer to Problem 31E
No, the model is not appropriate.
Explanation of Solution
The data from the World Bank for the western hemisphere countries is used to examine the association between female life expectancy and the average number of children women gave birth to. Thus, by the scatterplot we have the regression line for the data of life expectancy and the births per women. The model with Costa Rica is not appropriate as the residuals plot shows a distinct outlier, which is Costa Rica. When we remove this outlier Costa Rica it will give a better residual plot, suggesting that the linear equation is more appropriate.
(f)
To interpret the slope and y -intercept of the line.
(f)
Explanation of Solution
The data from the World Bank for the western hemisphere countries is used to examine the association between female life expectancy and the average number of children women gave birth to. Now, with the Costa Rica, the slope is near zero suggesting that the linear model is not very useful. The y -intercept suggest that with no births, the life expectancy is about
(g)
To explain if the government leaders wanted to increase life expectancy in their country than should they encourage women to have fewer children.
(g)
Answer to Problem 31E
No, they should not.
Explanation of Solution
The data from the World Bank for the western hemisphere countries is used to examine the association between female life expectancy and the average number of children women gave birth to. Thus, if the government leaders wanted to increase life expectancy in their country than they should not encourage women to have fewer children because while here is an association but there is no reason to expect causality and also in this lurking variables can be involved.
Chapter 9 Solutions
Stats: Modeling the World Nasta Edition Grades 9-12
Additional Math Textbook Solutions
Fundamentals of Statistics (5th Edition)
Basic Business Statistics, Student Value Edition
Basic Business Statistics, Student Value Edition (13th Edition)
Essentials of Statistics, Books a la Carte Edition (5th Edition)
Elementary Statistics: Picturing the World (7th Edition)
Essentials of Statistics (6th Edition)
 MATLAB: An Introduction with ApplicationsStatisticsISBN:9781119256830Author:Amos GilatPublisher:John Wiley & Sons Inc
 Probability and Statistics for Engineering and th...StatisticsISBN:9781305251809Author:Jay L. DevorePublisher:Cengage Learning
 Statistics for The Behavioral Sciences (MindTap C...StatisticsISBN:9781305504912Author:Frederick J Gravetter, Larry B. WallnauPublisher:Cengage Learning
 Elementary Statistics: Picturing the World (7th E...StatisticsISBN:9780134683416Author:Ron Larson, Betsy FarberPublisher:PEARSON
 The Basic Practice of StatisticsStatisticsISBN:9781319042578Author:David S. Moore, William I. Notz, Michael A. FlignerPublisher:W. H. Freeman
 Introduction to the Practice of StatisticsStatisticsISBN:9781319013387Author:David S. Moore, George P. McCabe, Bruce A. CraigPublisher:W. H. Freeman


