
Videos
(a)
Check whether the consumption of saccharin-flavored water differ in groups or not.
Find the test statistic value and make a decision to retain or reject the null hypothesis
(a)
Answer to Problem 21CAP
The test statistic value is 4.27.
The decision is to reject the null hypothesis.
There is significant difference between the consumption of saccharin-flavoured water of two groups.
Explanation of Solution
Calculation:
A sample of 8 rats is considered and they are rats feel sick and control group rats. The claim is the there is difference between the consumption of saccharin-flavoured water of two groups. This represents the alternative hypothesis. The level of significance is 0.05.
Let
Null hypothesis:
That is, there is no difference between the consumption of saccharin-flavoured water of two groups.
Alternative hypothesis:
That is, there is difference between the consumption of saccharin-flavoured water of two groups.
The degrees of freedom for t distribution is,
The test is two tailed, the degrees of freedom are 6, the level of significance is 0.05.
From the Appendix B: Table B.2 The t Distribution:
- Locate the value 6 in the degrees of freedom (df) column.
- Locate the 0.05 in the proportion in Two tails combined row.
- The intersecting value that corresponds to the 6 with level of significance 0.05 is 2.447.
The critical value for a two-tailed test with
Decision rules:
- If the positive test statistic value is greater than the positive critical value, then reject the null hypothesis or else retain the null hypothesis.
- If the negative test statistic value is less than negative critical value, then reject the null hypothesis or else retain the null hypothesis.
The formula of test statistic for one-sample t test is,
In the formula,
In the formula,
Software procedure:
Step by step procedure to obtain test statistic value using SPSS software is given as,
- Choose Variable view.
- Under the name, enter the names as Amounts, and Types of Rats.
- Choose Data view, enter the data.
- Choose Analyze>Compare means>Independent Samples T Test.
- In Test variables, enter the column as Amounts.
- In Grouping variables, enter thecolumn asTypes of Rats.
- Select Define Groups; enter Group 1 as 1 and Group 2 as 2.
- Click OK.
Output using SPSS software is given below:
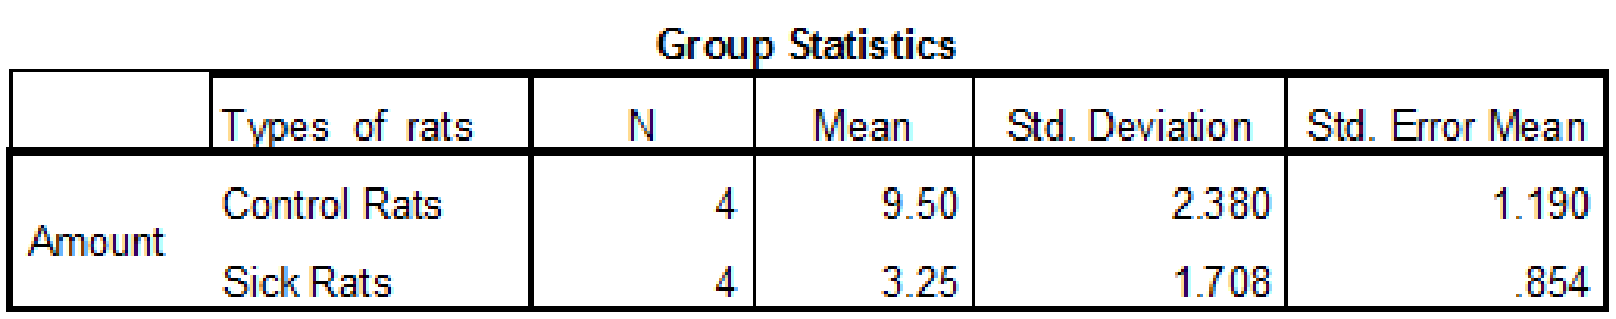
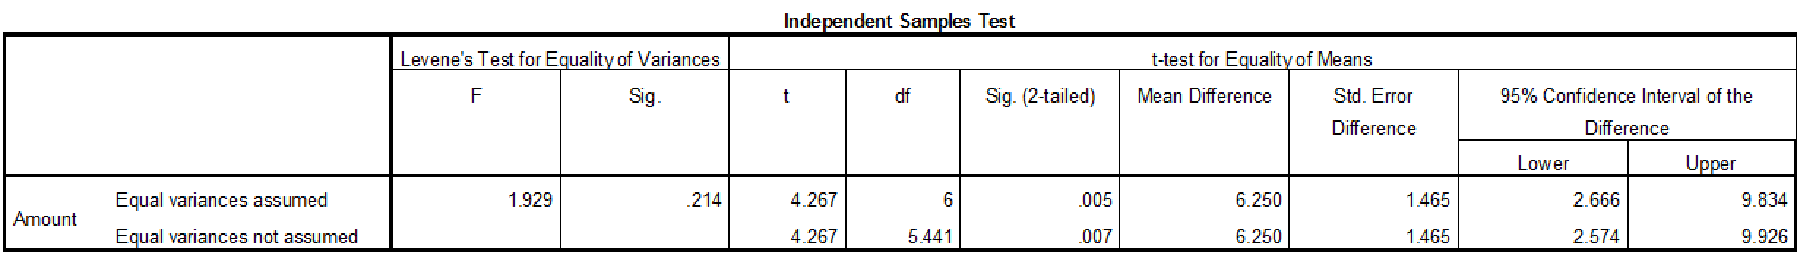
Thus, the test statistic value is 4.27.
Justification: The value of test statistic is 4.27 and critical value is 2.447. The test statistic value is greater than the critical value. The test statistic value fall under critical region and hence the null hypothesis is rejected.
Thus, there is significant difference between the consumption of saccharin-flavoured water of two groups.
(b)
Find the effect size by using eta-squared.
(b)
Answer to Problem 21CAP
The value of eta-squared is 0.75.
The effect size is large.
Explanation of Solution
Eta-square:
The proportion of variance is measured using eta-square. But eta-square is biased because it over estimates the proportion of variance that is explained by treatment. It is denoted by
In the formula, t is the value of test statistic and df is the corresponding degrees of freedom.
The description of effect size using eta-square:
- If value of eta-square is less than 0.01, then effect size is trivial.
- If value of eta-square is in between 0.01 and 0.09, then effect size is small.
- If value of eta-square is in between 0.10 and 0.25, then effect size is medium.
- If value of eta-square is greater than 0.25, then effect size is large.
Calculation:
From the SPSS output, the test statistic value is 4.27 and
The value of estimated eta-square is 0.75. This value is greater than 0.25. Hence the eta-square has a large effect size.
Want to see more full solutions like this?
Chapter 9 Solutions
Statistics for the Behavioral Sciences


- The effectiveness of a blood-pressure drug is being investigated. How might an experimenter demonstrate that, on average, the reduction in systolic blood pressure is 20 or more?arrow_forwardIndependent surveys show that the average IQ of 9 r/s babies exposed to cocaine in the uterus is 81 with s.d. 18, while the average IQ of 20 r/s babies unexposed to cocaine in the uterus is 99 with s.d. 9. Construct a 90% c.i. for the difference between the overall average IQs of exposed and unexposed babies. Assume that both populations are normal.arrow_forwardResearchers from the University of British Columbia conducted trials to investigate the effects of color on creativity. Subjects with a red background were asked to think of creative uses for a brick; other subjects with a blue background were given the same task. Responses were scored on a scale from 1 to 5 by a panel of judges and results from scores of creativity are given below. Higher scores correspond to more creativity. The researchers make the claim that “blue enhances performance on a creative task.” Red Background: n = 35, X bar = 3.39, s = .97 Blue Background: n = 36, X bar = 3.97, s = .63 Use a 0.01 significance level to test the claim that blue enhances performance on a creative task. Construct the confidence interval appropriate for the hypothesis test in part (a). What is it about the confidence interval that causes us to reach the same conclusion from part (a)?arrow_forward
- To investigate water quality, the Columbus Dispatch took water specimens at 16 Ohio State Park swimming areas in central Ohio. Those specimens were taken to laboratories and tested for E. coli, which are bacteria that can cause serious gastrointestinal problems. For reference, if a 100-milliliter specimen (about 3.3 ounces) of water contains more than 130 E. coli bacteria, it is considered unsafe. The E. coli levels per 100 milliliters found by the laboratories are presented in the table: 291.0 10.9 47.0 86.0 44.0 18.9 1.0 50.0 190.4 45.7 28.5 18.9 16.0 34.0 8.6 9.6 To access the complete data set, click the link for your preferred software format: Excel Minitab JMP SPSS TI R Mac-TXT PC-TXT CSV CrunchIt! Find the mean E. coli level. Mean E.coli level (rounded to two decimal places) per 100 mlarrow_forwardWe’re interested in whether warm milk helps people go to sleep faster. We have a lab with EEG monitors that will provide us with data as to how many minutes elapse before someone falls asleep. (People spend the night in the lab.) In the first experimental condition, participants fall asleep as they usually do, without warm milk. In the second condition, participants drink 6 oz. of warm milk before going to sleep. Data for 5 participants is shown in the table below. Choose the appropriate type of t-test (independent samples or paired samples) and conduct the t-test and hypothesis test. Be sure to show all of your calculations either on your scratch work or in this text box. DO: Include the t-test value and your hypothesis test conclusion in this text box, not just in your scratch work.arrow_forwardWe're interested in whether warm milk helps people go to sleep faster. We have a lab with EEG monitors that will provide us with data as to how many minutes elapse before someone falls asleep. (People spend the night in the lab.) In the first experimental condition, participants fall asleep as they usually do, without warm milk. In the second condition, participants drink 6 oz. of warm milk before going to sleep. Data for 5 participants is shown in the table below. Choose the appropriate type of t- test (independent samples or paired samples) and conduct the t-test and hypothesis test. Be sure to show all of your calculations either on your scratch work or in this text box. DO: Include the t-test value and your hypothesis test conclusion in this test box, not just in your scratch work. Minutes to Minutes to NO MILK sleep MILK sleep Participant 1 10 Participant 1 11 Participant 2 10 Participant 2 12 Participant 3 8. Participant 3 8 Participant 4 17 Participant 4 13 Participant 5 13…arrow_forward
- A sample of ore is found to be 0.0022% gold and 0.059% silver. What is the percentage of matter in the ore that is neither gold or silver?arrow_forwardThe following are the cystatin C levels (mg/L) for the patients described in Exercise 15 (A-17).Cystatin C is a cationic basic protein that was investigated for its relationship to GFR levels. In addition, creatinine levels are also given. (Note: Some subjects were measured more thanonce.) Cystatin C (mg/L) Creatinine (mmol/L) 1.78 4.69 0.35 0.14 2.16 3.78 0.30 0.11 1.82 2.24 0.20 0.09 1.86 4.93 0.17 0.12 1.75 2.71 0.15 0.07 1.83 1.76 0.13 0.12 2.49 2.62 0.14 0.11 1.69 2.61 0.12 0.07 1.85 3.65 0.24 0.10 1.76 2.36 0.16 0.13 1.25 3.25 0.17 0.09 1.50 2.01 0.11 0.12 2.06 2.51 0.12 0.06 2.34Source: D. M. Z. Krieser, M.D. Used with permission.(a) For each variable, compute the mean, median, variance, standard deviation, and coefficient ofvariation.(b) For each variable, construct a stem-and-leaf display and a box-and-whisker plot.(c) Which set of measurements is more variable, cystatin C or creatinine? On what do you baseyour answer? that question from…arrow_forwardRoy's Texaco wants to keep the price of its unleaded gasoline competitive with that of other stations in the area. Roy's is currently charging $1.29 per gallon. To check that the average price for this gasoline for all stations within 12-mile radius is higher than his price, Roy randomly samples the price of unleaded gasoline at ten stations located in this area. He obtains the following data for the price per gallon (in dollars): 1.7, 1.5, 2.6, 2.2, 2.4, 2.3, 2.6, 3.0, 1.4, 2.3 Set up appropriate hypotheses and test them using a significant level of .01.arrow_forward
- Roy ‘s Texaco wants to keep the price of its unleaded gasoline competitive with that of other stations in the area. Roy’s is currently charging $1.29 per gallon. To check that the average price for this gasoline for all stations within a 15 mile radius is higher than his price, Roy randomly samples the price of unleaded gasoline at ten stations located in this area. He obtains the following data for the price per gallon (in dollars): 1.7, 1.5, 2.6, 2.2, 2.4, 2.3, 2.6, 3.0, 1.4, 2.3 Set up the appropriate hypotheses and test them using a significance level of α= .05arrow_forwardA researcher would like to examine how the chemical tryptophan, contained in foods such as turkey, can affect mental alertness. A sample of n = 9 college students is obtained and each student’s performance on a familiar video game is measured before and after eating a traditional Thanksgiving dinner including roast turkey. The average score dropped by M = 14 points after the meal with SS = 1152 for the difference scores. A. Is there is significant difference in performance before eating versus after eating? Use a two-tailed test with α = .05. SMD = ___________________________ tcritical = ________________________ tcalculated = ________________________ Decision = _______________________ B. Compute r2 to measure the size of the effect. r2 = _____________________________ C. Write a sentence demonstrating how the outcome of the test and the measure of effect size would…arrow_forward
 Glencoe Algebra 1, Student Edition, 9780079039897...AlgebraISBN:9780079039897Author:CarterPublisher:McGraw Hill