Concept explainers
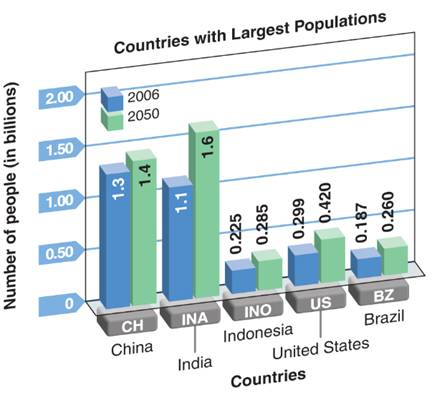
Population Growth The double-bar graph illustrates the predicted population explosion by the year 2050. Use this graph to answer exercises 13–-20.

When we work with large numbers such as millions and billions, we can simplify the calculations if we write the words million or billion in place of the zeros. For example, to subtract
How much greater is the population predicted to be in the United States in 2050 than in 2006?
Want to see the full answer?
Check out a sample textbook solution
Chapter 9 Solutions
Prealgebra (6th Edition)
- Please don't provide handwritten solution...arrow_forwardExample 16 A bicycle is traveling at 15 miles per hour. How many feet will it cover in 20 seconds?arrow_forwardfx) = 1,000+25x, where * represents of how many months did the value of the savings bond first begin to exceed the value of the savings account? A. 27 months B. 28 months C. 32 months D. 33 months Part 3: Lesson 4.3 (Graphing Exponential Functions) Standards: F.IF.6, F.IF.7 9. Which point lies on the graph of (1.2-) A. 1. 2 B. C. C2, 18) D. C3, 2) 10. Which is the graph of y = -2(2)*? 8+arrow_forward
- The bar graph shows the average cost of tuition and fees at private four-year colleges in a particular country. Below are two mathematical models for the data shown in the graph. In each formula, T represents the average cost of tuition and fees at private colleges for the school year ending x years after 2000. Answer parts a and b. Average Cost of Tuition and Fees at Private Four-Year Colleges 22 20- 22,051 21,057 20,095 19,128 18,135 18- 16.203 16 15 218 17,168 Model 1 T= 974x+ 15,223 Model 2 T= - 2.1x + 988x + 15,208 14 2000 2001 20022003 2004 2005 2006 2007 a. Use each model to find the average cost of tuition and fees at private colleges for the school vear ending in 2003. By how much does each model underestimate or overestimate the actual cost shown for the school year ending in 2003? HIHE The average cost given by model 1 is $ Round to the nearest dollar.) Help Me Solve This Textbook Get More Help - Clear All Skill Builder Check Answer 10.19 PM 65°F 9/6/2021 Type here to search…arrow_forwardHelparrow_forwardPart D only HANDWRITTEN answer needed ( NOT TYPED)arrow_forward
- A pattern of dots grows exponentially. The table shows the number of dots at each step of the pattern. step number 012 3 number of dots 15 25 125 1. Write an equation to represent the relationship between the step number, n, and the number of dots, y. 2. At one step, there are 9,765,625 dots in the pattern. At what step number will that happen? Explain how you know.arrow_forwardpoint A cable company uses the formula S = 20,000 (1 +0.08) to estimate the number of subscribers, S, that use their service after y years. If there were 20,000 cable television subscribers when the cable company began, what is the meaning of the expression (1 + 0.08)'? %3D A. Every year the number of subscribers is estimated to increase by 8 over the number of subscribers the year before. B. Every year the number of subscribers is estimated to increase by 8% of the original 20,000 subscribers. C. Every year the number of subscribers is estimated to increase by 8% over the number of subscribers the year before. D. Every year the number of subscribers is estimated to increase by 80% of the original 20,000 subscribers.arrow_forwardplease refer tp the photo belowarrow_forward
 Big Ideas Math A Bridge To Success Algebra 1: Stu...AlgebraISBN:9781680331141Author:HOUGHTON MIFFLIN HARCOURTPublisher:Houghton Mifflin Harcourt
 College Algebra (MindTap Course List)AlgebraISBN:9781305652231Author:R. David Gustafson, Jeff HughesPublisher:Cengage Learning

 Trigonometry (MindTap Course List)TrigonometryISBN:9781337278461Author:Ron LarsonPublisher:Cengage Learning
 Algebra for College StudentsAlgebraISBN:9781285195780Author:Jerome E. Kaufmann, Karen L. SchwittersPublisher:Cengage Learning


