
Concept explainers
Videos
The graph shows stopping distances for trucks at various speeds on dry roads and on wet roads. Use this information to solve Exercises 88–89.
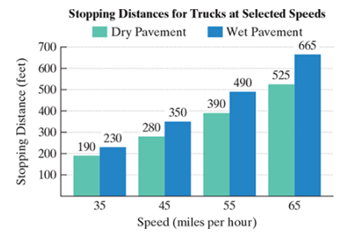
a. Use the statistical menu of your graphing utility and the quadratic regression program to obtain the quadratic function that models a truck’s stopping distance,
b. Use the function from part (a) to determine speeds on dry pavement requiring stopping distances that exceed 455 feet. Round to the nearest mile per hour.
Want to see the full answer?
Check out a sample textbook solution
Chapter 8 Solutions
Intermediate Algebra for College Students Access Card Package (7th Edition) (Blitzer Developmental Algebra Series)


- Use this information to solve Exercises 9–11:A company is planning to produce and sell a new line of computers. The fixed cost will be $360,000 and it will cost $850 to produce each computer. Each computer will be sold for $1150. 9. Write the cost function, C, of producing x computers. 10. Write the revenue function, R, from the sale of x computers. 11. Determine the break-even point. Describe what this means.arrow_forwardWorld Military Expenditure The following chart shows total military and arms trade expenditure from 2011–2020 (t = 1 represents 2011). †A bar graph titled "World military expenditure" has a horizontal t-axis labeled "Year since 2010" and a vertical axis labeled "$ (billions)". The bar graph has 10 bars. Each bar is associated with a label and an approximate value as listed below. 1: 1,800 billion dollars 2: 1,775 billion dollars 3: 1,750 billion dollars 4: 1,730 billion dollars 5: 1,760 billion dollars 6: 1,760 billion dollars 7: 1,850 billion dollars 8: 1,900 billion dollars 9: 1,950 billion dollars 10: 1,980 billion dollars (a) If you want to model the expenditure figures with a function of the form f(t) = at2 + bt + c, would you expect the coefficient a to be positive or negative? Why? HINT [See "Features of a Parabola" in this section.] We would expect the coefficient to be positive because the curve is concave up. We would expect the coefficient to be negative because the…arrow_forwardFor Exercises 49–52, rewrite the equation so that the coefficient on x is positive.arrow_forward
- U.S. Population The number of White non-Hispanicindividuals in the U.S. civilian non-institutional population 16 years and older was 153.1 million in 2000and is projected to be 169.4 million in 2050.(Source: U.S. Census Bureau)a. Find the average annual rate of change in population during the period 2000–2050, with the appropriate units.b. Use the slope from part (a) and the population in2000 to write the equation of the line associatedwith 2000 and 2050.c. What does this model project the population to bein 2020?arrow_forwardAmerica is getting older. The graph shows the projected elderly U.S. population for ages 65–84 and for ages 85 and older.The formula E = 5.8√x + 56.4 models the projected number of elderly Americans ages 65–84, E, in millions, x years after 2020.a. Use the formula to find the projected increase in the number of Americans ages 65–84, in millions, from 2030 to 2060. Express this difference in simplified radicalform.b. Use a calculator and write your answer in part (a) to the nearest tenth. Does this rounded decimal overestimate or underestimate the difference in the projected data shown by the bar graph ? By how much?arrow_forwardThe average amount A (in pounds per person) of fish and shellfish consumed in the UnitedStates during the period 1992–2001 can be modeled by A = (3.2x + 260)/(52x + 3800) where x is the number of years since 1992.Rewrite the model so that it has only whole number coefficients. Then simplify the model.arrow_forward
- In Exercises 41–48, write a piecewise formula for the function.arrow_forwardIn Exercises 1–6, solve for x.arrow_forwardFind the formula for a linear function f that models the data in the table exactly. 1 2 f(x) 4 1 f(x) = D (Simplify your answer. Do not factor. Use integers or fractions for any numbers in the expression.)arrow_forward
- The water level in a glass decreases 0.4 cm each hour due to evaporation. At the beginning of the experiment, the water level is 12.6 cm. Let x represent time, in hours, elapsed since the beginning of the experiment and let y represent the water level, in centimeters. Part A Construct a linear function, using x and y from above, that determines the water level at a given time, in hours, after the experiment begins.arrow_forwardproblen 1.2arrow_forwardExercises 93–94: Energy The following graph shows U.S. Energy consumption. 400 350 300 250 200 150 100 50 04 1970 1990 2010 Year 93. When was energy consumption increasing? 94. When was energy consumption decreasing? Energy (millions of Btu)arrow_forward
 Algebra & Trigonometry with Analytic GeometryAlgebraISBN:9781133382119Author:SwokowskiPublisher:Cengage