
Videos
A sample of n sludge specimens is selected and the pH of each one is determined. The one-sample t test will then be used to see if there is compelling evidence for concluding that true average pH is less than 7.0. What conclusion is appropriate in each of the following situations?
- a. n = 6, t = −2.3, α = .05
- b. n = 15, t = −3.1, α = .01
- c. n = 12, t = −1.3, α = .05
- d. n = 6, t = .7, α = .05
- e. n = 6,
a.
Find the appropriate conclusion for the given situation.
Answer to Problem 30E
There is sufficient evidence to support that true average pH is less than 7 for this situation.
Explanation of Solution
Given info:
A sample of size n sludge specimens was collected for checking pH. The t test was used for concluding that true average pH is less than 7.
Calculation:
Hypothesis:
Null hypothesis:
Alternative hypothesis:
P-value:
Software procedure:
Step by step procedure to obtain the P-value using the MINITAB software is given below:
- Choose Graph > Probability Distribution Plot choose View Probability > OK.
- From Distribution, choose ‘t’ distribution, degrees of freedom as 5.
- Click the Shaded Area tab.
- Choose X Value and left for the region of the curve to shade.
- Enter the data value as –2.3.
- Click OK.
Output using the MINITAB software is given below:
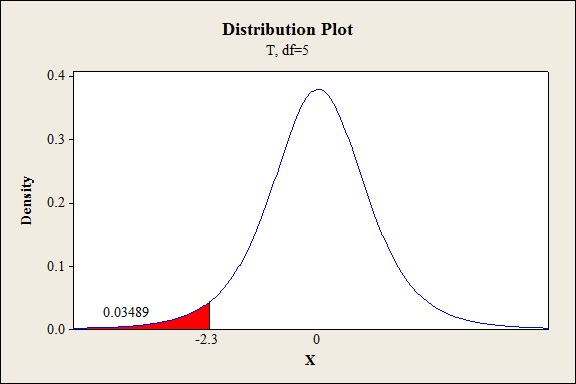
From the MINITAB output, the P-value is 0.0348.
Decision:
If
If
Conclusion:
Here, the P-value is less than the level of significance.
That is,
By rejection rule, reject null hypothesis.
Hence, there is sufficient evidence to support that true average pH is less than 7 for this situation.
b.
Find the appropriate conclusion for the given situation.
Answer to Problem 30E
There is sufficient evidence to support that true average pH is less than 7 for this situation.
Explanation of Solution
Given info:
Calculation:
P-value:
Software procedure:
Step by step procedure to obtain the P-value using the MINITAB software is given below:
- Choose Graph > Probability Distribution Plot choose View Probability > OK.
- From Distribution, choose ‘t’ distribution, degrees of freedom as 14.
- Click the Shaded Area tab.
- Choose X Value and left for the region of the curve to shade.
- Enter the data value as –3.1.
- Click OK.
Output using the MINITAB software is given below:
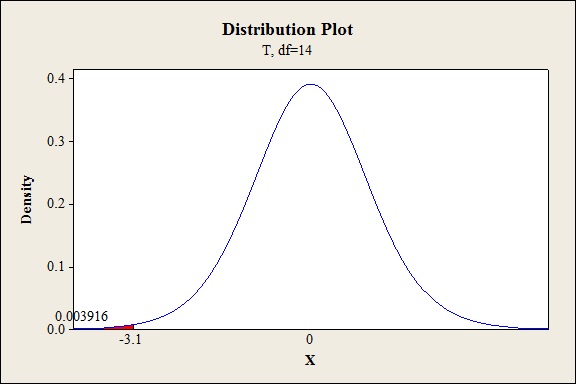
From the MINITAB output, the P-value is 0.0039.
Conclusion:
Here, the P-value is less than the level of significance.
That is,
By rejection rule, reject null hypothesis.
Hence, there is sufficient evidence to support that true average pH is less than 7 for this situation.
c.
Find the appropriate conclusion for the given situation.
Answer to Problem 30E
There is no sufficient evidence to support that true average pH is less than 7 for this situation.
Explanation of Solution
Given info:
Calculation:
P-value:
Software procedure:
Step by step procedure to obtain the P-value using the MINITAB software is given below:
- Choose Graph > Probability Distribution Plot choose View Probability > OK.
- From Distribution, choose ‘t’ distribution, degrees of freedom as 11.
- Click the Shaded Area tab.
- Choose X Value and left for the region of the curve to shade.
- Enter the data value as –1.3.
- Click OK.
Output using the MINITAB software is given below:
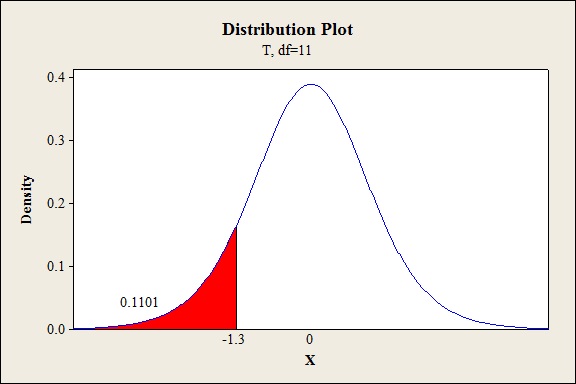
From the MINITAB output, the P-value is 0.1101
Conclusion:
Here, the P-value is greater than the level of significance.
That is,
By rejection rule, fail to reject null hypothesis.
Hence, there is no sufficient evidence to support that true average pH is less than 7 for this situation.
d.
Find the appropriate conclusion for the given situation.
Answer to Problem 30E
There is no sufficient evidence to support that true average pH is less than 7 for this situation.
Explanation of Solution
Given info:
Calculation:
P-value:
Software procedure:
Step by step procedure to obtain the P-value using the MINITAB software is given below:
- Choose Graph > Probability Distribution Plot choose View Probability > OK.
- From Distribution, choose ‘t’ distribution, degrees of freedom as 5.
- Click the Shaded Area tab.
- Choose X Value and left for the region of the curve to shade.
- Enter the data value as 0.7.
- Click OK.
Output using the MINITAB software is given below:
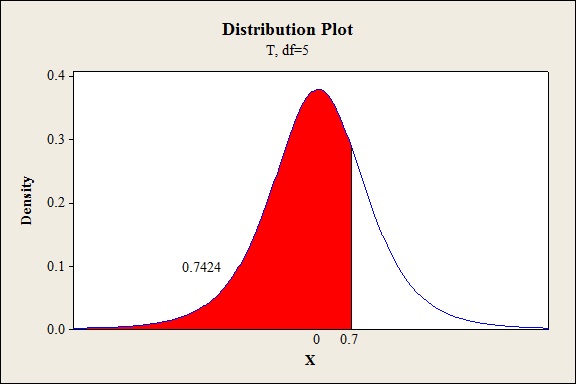
From the MINITAB output, the P-value is 0.7424.
Conclusion:
Here, the P-value is greater than the level of significance.
That is,
By rejection rule, fail to reject null hypothesis.
Hence, there is no sufficient evidence to support that true average pH is less than 7 for this situation.
e.
Find the appropriate conclusion for the given situation.
Answer to Problem 30E
There is sufficient evidence to support that true average pH is less than 7 at 5% level of significance.
Explanation of Solution
Given info:
Calculation:
Step 1: Parameter of interest:
Let
Step 2: Null hypothesis:
Step 3: Alternative hypothesis:
Step 4: Test statistic:
Software procedure:
Step by step procedure to obtain the test-statistic value using the MINITAB software:
- Choose Stat > Basic Statistics > 1-Sample Z.
- In Summarized data, enter the sample size as 6 and mean as 6.68.
- In Standard deviation, enter 0.2.
- In Perform hypothesis test, enter the test mean as 7
- Check Options; enter Confidence level as 95%.
- Choose less than in alternative.
- Click OK in all dialogue boxes.
Output using the MINITAB software is given below:
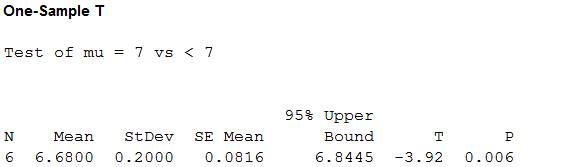
From the MINITAB output, the test statistic value is –3.92
Step 5: P-value:
From the output of step 4, the P-value is given by 0.006.
Step 5: Decision:
If
If,
Conclusion:
Here, the P-value is less than the level of significance.
That is,
By rejection rule, reject null hypothesis.
Step 6: Interpretation:
Thus, it can be concluded that there is sufficient evidence to support that true average pH is less than 7 at 5% level of significance.
Want to see more full solutions like this?
Chapter 8 Solutions
Student Solutions Manual for Devore's Probability and Statistics for Engineering and the Sciences, 9th


- Fifty male subjects drank a measured amount x (in ounces) of a medication and the concentration y (in percent) in their blood of the active ingredient was measured 30 minutes later. The sample data are summarized by the following information: n = 50 Ex = 112.5 Ex? = 356.25 %3D Ey = 4.83 Ey = 0.667 Exy = 15.255 0 < x < 4.5 Or= 0.875 Or= 0.709 Or= -0.846 Or=0.460 Or= 0.965arrow_forward1. As heat is added to a material its temperature rises. The heat capacity is a quantitative statement of the increase in temperature for a specified addition of heat. These data are obtained in X, the measured heat capacity of liquid ethylene glycol at constant pressure and 80° C. Measurements are in calories per gram degree Celsius: .645 .654 .640 .627 .626 .649 .629 .631 .643 .633 .646 .630 .634 .631 .651 .659 .638 .645 .655 .624 .658 .658 .658 .647 .665 Assume that X is normally distributed. Find a 95% confidence interval for µ.arrow_forwardIn a population with o = 6, a score of X = 48 corresponds to z = 1.25. The mean for this population is u =arrow_forward
- 1. Can balloons hold more air or more water before bursting? A student purchased a large bag of 12-inch balloons. He randomly selected 10 balloons from the bag and then randomly assigned half of them to be filled with air until bursting and the other half to be filled with water until bursting. He used devices to measure the amount of air and water was dispensed until the balloons burst. Here's the data: Air (ft') Water (ft) 0.52 0.44 0.58 0.41 0.50 0.55 0.46 0.61 0.38 0.45 Does the data give convincing evidence air filled balloons can attain a greater volume than water filled balloons?arrow_forwardfourteen different video games showing alcohol use were observed. The duration times of alcohol use (in seconds) were recorded. When using this sample for a t test of the claim that the population mean is greater than 83 sec, what does df denote, and what is its value? 1.What does df denote? 2. The value of DFarrow_forwardYour local gas company is interested in estimating the average usage during the month of January. A random sample of 1280 households found the following results: X= 82 therms and s=28 therms. Conduct a test of hypothesis to determine if the average amount exceeds 80 therms. Use a=0.02.arrow_forward
- In a statistical study, the summary data are given as follows n = 35, =5, y=4 x,y, = 1000 > yi = 1900 %3D The Coefficient of Determination (R²) equals to = O a. 0.935 Ob.0.783 O c.0.742 O d. 0.828 O e. 0.878 O f.0.706 O g. Nonearrow_forwardGiven that n=82 data points are collected when studying the relationship between average daily temperature and time spent watching television, use the critical values table below to determine if a calculated value of r=−0.974 is significant or not. df CV (+ and -) df CV (+ and -) df CV (+ and -) df CV (+ and -) 1 0.997 11 0.555 21 0.413 40 0.304 2 0.950 12 0.532 22 0.404 50 0.273 3 0.878 13 0.514 23 0.396 60 0.250 4 0.811 14 0.497 24 0.388 70 0.232 5 0.754 15 0.482 25 0.381 80 0.217 6 0.707 16 0.468 26 0.374 90 0.205 7 0.666 17 0.456 27 0.367 100 0.195 8 0.632 18 0.444 28 0.361 9 0.602 19 0.433 29 0.355 10 0.576 20 0.423 30 0.349 Select the correct answer below: r is significant because it is between the positive and negative critical values. r is not significant because it is between the positive and negative critical values. r is significant because it is not between the positive and negative critical values. r is not…arrow_forwardArsenic-based additives in chicken feed have been banned by the European Union. Ifa restaurant chain finds significant evidence that the mean arsenic level of theirchickens is above 80 ppb (parts per billion), the chain will stop using that supplier ofchicken meat. The hypotheses are: H 0 : µ = 80H 1 : µ > 80 where µ represents the mean arsenic level in all chicken meat from that supplier.Samples from two different suppliers are analyzed, and the resulting p-values aregiven: Sample from Supplier A: p-value is 0.0003Sample from Supplier B: p-value is 0.3500 a) Interpret each p-value in terms of the probability of the results happening byrandom chance. b) Which p-value shows stronger evidence for the alternative hypothesis? c) Which supplier, A or B, should the chain get chickens from in order to avoid toohigh a level of arsenic?arrow_forward
- The acidity of the water in a swimming pool is considered normal if the average of three pH readings is between 7.2 and 7.8 and 7.8, inclusive. The first two readings for a swimming pool are 7.4 and 7.9. What possible values for the third reading p will make the average pH normal?arrow_forwardThe mean number of credits earned by students is claimed to be 30.0. A random sample is taken to test if the mean is different. The sample has x = 31.2 s= 2.1, and n= 40. %3D Use this data to solve problems 7 through 11. The stem and leaf plot below shows the running times in a 400 m run for a random sample of 19 runners. 6|0 represents 60 seconds. Use this data for questions 18 through 21. 5|89 6|01558 7|0246689 8|12335 For a one samplet-test with sample size 58, the degrees of freedom is: а. 58 O b. 59 О с. 57arrow_forwardAn analyst wants to know whether there is any significant difference in the measurement results produced by alternative method compared a reference method in determination of the concentration of vitamin C in vegetables. He analysed eight different test materials using the both methods and the results are shown below: Test if the alternative method provides compatible measurement results at significant level of 0.05. Given that ?? = 2.365. (? = 0.296)arrow_forward
 Calculus For The Life SciencesCalculusISBN:9780321964038Author:GREENWELL, Raymond N., RITCHEY, Nathan P., Lial, Margaret L.Publisher:Pearson Addison Wesley,