
Concept explainers
Videos
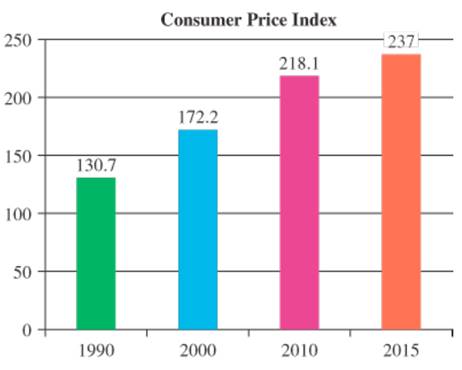
The Consumer Price Index (CPI) is a measure of inflation obtained by comparing current prices with base prices in 1982–84. We can find the inflation rate for a given time period by calculating the percent of change in the CPI over that time period. For example, the CPI in 2005 was 195.3 and in 2009 it was 214.5, so the inflation rate was
Effect of inflation on the cost of cars.
a. Calculate the inflation rate from 1990 to 2010.
b. If a car cost $17,000 in 2010, use the inflation rate from part (a) to estimate what the car would have cost in 1990.
Want to see the full answer?
Check out a sample textbook solution
Chapter 8 Solutions
Mathematics All Around (6th Edition)


- The table below reports the annual stock price in September for Apple from 2005 to 2014. Develop a simple index for the change in earning per share over the period. Use 2005 as the base period. percentages (e.g. 131.32 instead of 1.31)) (Indexes should be rounded to 2 decimal places and be in Year Earnings Per Share ($) Simple Index 2005 4.32 2006 4.14 2007 4.86 2008 5.94 2009 6.76 2010 10.08 2011 16.51 2012 23.65 2013 26.21 2014 29.86 Click here for the Excel Data File, Data file should open in a new browswer window. Select "File" then "Save As" to download the file to your computer and be able to use it in Excel. a. By what percent have stock prices changed from 2005 to 2009? b. By what percent have stock prices changed from 2005 to 2014? c. By what percent have stock prices changed from 2009 to 2014?arrow_forward4.56% represents an average increase in average price per year. a student incorrectly calculated this average using 25%/5years=5% per year. Show this answer is not correct by calculating 5 successive 5% increases. What is 5 the year percent change using the 5% per year?arrow_forwardc. Predict sales in 15 years.arrow_forward
- The annual number of burglaries in a town rose by 50% in 2012 and fell by 10% in 2013. Hence the total number of burglaries increased by 40% over the two year period. What is the mistaken assumption here? Why is that assumption incorrect? By what percent has the number of burglaries actually changed in the two year period? show calculation By what percent would the crime have to decrease in the second year in order for the change over the two-year period to actually be a 40% increase? Round to nearest 10th percent (ex decimal .05873 is 5.873% to one decimal is 5.9%) show calculationarrow_forwardWhen the rate of inflation is 4(1/2)% per year and the average price of a car is currently $25,000, the average price after n years is Pn = $25,000(1.045)n . Compute the average prices for the next 5 years.arrow_forwardThe following is the data of inflation rates in the Japan from 2011 to 2019. Determine the rate in the years 2013, 2016, and 2018 using Lagrange Interpolation. Show the solutionarrow_forward
- 2. Find the seasonal index for each quarter.arrow_forwardA company first six month of a certain year made 30% profit, and last six months lost 30%. What percent is the overall profit or loss at the end of the year?arrow_forwardIn January 2005, the population of California was 36.8 million and growing at an annual rate of 1.3%. Assume that growth continues at the same rate. (a) By how much will the population increase between 2005 and 2035? By million (to the nearest 0.001 million) (b) By how much will the population increase between 2035 and 2065? By million (to the nearest 0.001 million) (c) Explain how you can tell before doing the calculations which of the two answers in parts (a) and (b) is larger. Select ALL statements in A-F which are true if more than one is possible. A. The calculation in part (b) is larger since the exponential function is concave up, and the average rate of change is increasing as time goes on. B. The calculation in part (a) is larger since the function is exponential, and exponential graphs grow faster at first, and then flatten. C. The calculation in part (a) is larger since the graph of the function is concave down, and the average rate of change is decreasing as time goes on.…arrow_forward
- The median selling price of an existing home in the United States increasing continuously over the period 2011-2013 at the rate of 8.5% per year from aproximately $166,00 in 2011. Write down the formula that predicts the median selling price of an existing on t years after 2011.Use the monitor estimate to the nearest $1000 the median selling price of an existing home in 2013 and 2015arrow_forwardSuppose that Colorado population grows consistently at 2.4% per year. If the 2021 colorado population is 3.34 million, in what year will the population reach 10 million?arrow_forwardThe revenue (in dollars) from the sale of x infant car seats is given by R(x) = 67x -0.02x², 0arrow_forwardarrow_back_iosSEE MORE QUESTIONSarrow_forward_ios
 Discrete Mathematics and Its Applications ( 8th I...MathISBN:9781259676512Author:Kenneth H RosenPublisher:McGraw-Hill Education
 Mathematics for Elementary Teachers with Activiti...MathISBN:9780134392790Author:Beckmann, SybillaPublisher:PEARSON
 Thinking Mathematically (7th Edition)MathISBN:9780134683713Author:Robert F. BlitzerPublisher:PEARSON
 Discrete Mathematics With ApplicationsMathISBN:9781337694193Author:EPP, Susanna S.Publisher:Cengage Learning,
 Pathways To Math Literacy (looseleaf)MathISBN:9781259985607Author:David Sobecki Professor, Brian A. MercerPublisher:McGraw-Hill Education