
Videos
a.
To find: Whether it could be assumed that the condition required to construct a confidence interval for
a.
Answer to Problem 35E
Yes
Explanation of Solution
Given:
The provided box plot is:
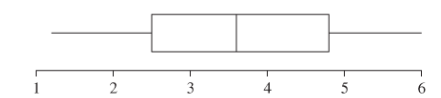
The provided box plot shows the mean half -life. In this no outlier is present, it could be said that this sample has been taken from the normally distributed population. Since, the normality condition is satisfied it could be assumed that the condition required to construct a confidence interval for mean half-life is satisfied
b.
To find: The confidence interval for the mean half-life the provided size
b.
Answer to Problem 35E
The required confidence interval is
Explanation of Solution
Formula used:
Given:
Drug’s half-life of randomly selected 18 sample are:
3.3, 1.7, 2.0, 5.0, 1.2, 2.8, 3.7, 3.5, 4.8, 4.7, 4.9, 2.5, 5.1, 6.0, 3.9, 4.3, 2.1, 3.0
Calculation:
Since, sample size is less than 30 and population standard deviation is not known therefore, here t- distribution is to be used.
Sample mean and standard deviation for the provided sample data can be computed as:
| Data | Data-Mean | (Data-mean) ^2 |
| 3.3 | -0.2 | 0.04 |
| 1.7 | -1.88 | 3.5344 |
| 2 | -1.58 | 2.4964 |
| 5 | 1.42 | 2.0164 |
| 1.2 | -2.38 | 5.6644 |
| 2.8 | -0.78 | 0.6084 |
| 3.7 | 0.12 | 0.0144 |
| 3.5 | -0.08 | 0.0064 |
| 4.8 | 1.22 | 1.4884 |
| 4.7 | 1.12 | 1.2544 |
| 4.9 | 1.32 | 1.7424 |
| 2.5 | -1.08 | 1.1664 |
| 5.1 | 1.52 | 2.3104 |
| 6 | 2.42 | 5.8564 |
| 3.9 | 0.32 | 0.1024 |
| 4.3 | 0.32 | 0.1024 |
| 2.1 | 1.32 | 1.7424 |
| 3 | -0.58 | 0.3364 |
The 95% confidence interval for the mean prices can be calculated as:
Degree of freedom = 18-1 = 17.
Thus, t- critical (table) value at 5% significance level and 17 degree of freedom is
c.
To find: whether this confidence interval (part b) contradict the national health claims that the mean half-life 3.51
c.
Answer to Problem 35E
Yes
Explanation of Solution
Since, the calculated confidence interval in part b ranges from 2.93 to 4.23, so it can be easily seen that the hypotheses value of national health includes in it
Want to see more full solutions like this?
Chapter 8 Solutions
Elementary Statistics ( 3rd International Edition ) Isbn:9781260092561


- What does the y -intercept on the graph of a logistic equation correspond to for a population modeled by that equation?arrow_forwardUse this data for the exercises that follow: In 2013, there were roughly 317 million citizens in the United States, and about 40 million were elderly (aged 65 and over).[34] 60. It is predicted that by 2030, one in five U.S. citizens will be elderly. How much greater will the chances of meeting an elderly person be at that time? What policy changes do you foresee if these statistics hold true?arrow_forwardIs carbon dating? Why does it work? Give an example in which carbon dating would be useful.arrow_forward
- Cable TV The following table shows the number C. in millions, of basic subscribers to cable TV in the indicated year These data are from the Statistical Abstract of the United States. Year 1975 1980 1985 1990 1995 2000 C 9.8 17.5 35.4 50.5 60.6 60.6 a. Use regression to find a logistic model for these data. b. By what annual percentage would you expect the number of cable subscribers to grow in the absence of limiting factors? c. The estimated number of subscribers in 2005 was 65.3million. What light does this shed on the model you found in part a?arrow_forwardUrban Travel Times Population of cities and driving times are related, as shown in the accompanying table, which shows the 1960 population N, in thousands, for several cities, together with the average time T, in minutes, sent by residents driving to work. City Population N Driving time T Los Angeles 6489 16.8 Pittsburgh 1804 12.6 Washington 1808 14.3 Hutchinson 38 6.1 Nashville 347 10.8 Tallahassee 48 7.3 An analysis of these data, along with data from 17 other cities in the United States and Canada, led to a power model of average driving time as a function of population. a Construct a power model of driving time in minutes as a function of population measured in thousands b Is average driving time in Pittsburgh more or less than would be expected from its population? c If you wish to move to a smaller city to reduce your average driving time to work by 25, how much smaller should the city be?arrow_forward
 Linear Algebra: A Modern IntroductionAlgebraISBN:9781285463247Author:David PoolePublisher:Cengage Learning
 Functions and Change: A Modeling Approach to Coll...AlgebraISBN:9781337111348Author:Bruce Crauder, Benny Evans, Alan NoellPublisher:Cengage Learning
 Glencoe Algebra 1, Student Edition, 9780079039897...AlgebraISBN:9780079039897Author:CarterPublisher:McGraw Hill
 Algebra & Trigonometry with Analytic GeometryAlgebraISBN:9781133382119Author:SwokowskiPublisher:Cengage