
Essentials Of Statistics For Business & Economics
9th Edition
ISBN: 9780357045435
Author: David R. Anderson, Dennis J. Sweeney, Thomas A. Williams, Jeffrey D. Camm, James J. Cochran
Publisher: South-Western College Pub
expand_more
expand_more
format_list_bulleted
Concept explainers
Videos
Textbook Question
Chapter 8.2, Problem 20E
Automobile Insurance Premiums. The average annual premium for automobile insurance in the United States is $1503. The following annual premiums ($) are representative of the website’s findings for the state of Michigan.
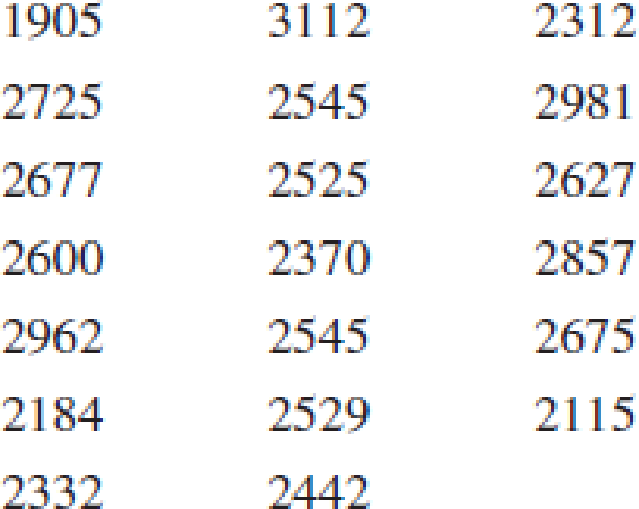
Assume the population is approximately normal.
- a. Provide a point estimate of the
mean annual automobile insurance premium in Michigan. - b. Develop a 95% confidence interval for the mean annual automobile insurance premium in Michigan.
- c. Does the 95% confidence interval for the annual automobile insurance premium in Michigan include the national average for the United States? What is your interpretation of the relationship between auto insurance premiums in Michigan and the national average?
Expert Solution & Answer

Trending nowThis is a popular solution!

Students have asked these similar questions
08:34
◄ Classroom
07:59
Probs. 5-32/33
D
ا.
89
5-34. Determine the horizontal and vertical components
of reaction at the pin A and the normal force at the smooth
peg B on the member.
A
0,4 m
0.4 m
Prob. 5-34
F=600 N
fr
th
ar
0.
163586
5-37. The wooden plank resting between the buildings
deflects slightly when it supports the 50-kg boy. This
deflection causes a triangular distribution of load at its ends.
having maximum intensities of w, and wg. Determine w
and wg. each measured in N/m. when the boy is standing
3 m from one end as shown. Neglect the mass of the plank.
0.45 m
3 m
Examine the Variables: Carefully review and note the names of all variables in the dataset. Examples of these variables include:
Mileage (mpg)
Number of Cylinders (cyl)
Displacement (disp)
Horsepower (hp)
Research: Google to understand these variables.
Statistical Analysis: Select mpg variable, and perform the following statistical tests. Once you are done with these tests using mpg variable, repeat the same with hp
Mean
Median
First Quartile (Q1)
Second Quartile (Q2)
Third Quartile (Q3)
Fourth Quartile (Q4)
10th Percentile
70th Percentile
Skewness
Kurtosis
Document Your Results:
In RStudio: Before running each statistical test, provide a heading in the format shown at the bottom. “# Mean of mileage – Your name’s command”
In Microsoft Word: Once you've completed all tests, take a screenshot of your results in RStudio and paste it into a Microsoft Word document. Make sure that snapshots are very clear. You will need multiple snapshots. Also transfer these results to the…
Chapter 8 Solutions
Essentials Of Statistics For Business & Economics
Ch. 8.1 - A simple random sample of 40 items resulted in a...Ch. 8.1 - 2. A simple random sample of 50 items from a...Ch. 8.1 - A simple random sample of 60 items resulted in a...Ch. 8.1 - 4. A 95% confidence interval for a population mean...Ch. 8.1 - Data were collected on the amount spent by 64...Ch. 8.1 - Travel Taxes. In an attempt to assess total daily...Ch. 8.1 - Cost of Dog Ownership. Money reports that the...Ch. 8.1 - Studies show that massage therapy has a variety of...Ch. 8.1 - Cost to Repair Fire Damage. The mean cost to...Ch. 8.1 - 10. Costs are rising for all kinds of medical...
Ch. 8.2 - For a t distribution with 16 degrees of freedom,...Ch. 8.2 - Find the t value(s) for each of the following...Ch. 8.2 - The following sample data are from a normal...Ch. 8.2 - A simple random sample with n = 54 provided a...Ch. 8.2 - 15. Sales personnel for Skillings Distributors...Ch. 8.2 - Years to Bond Maturity. A sample containing years...Ch. 8.2 - Quality Ratings of Airports. The International Air...Ch. 8.2 - Unemployment in Older Workers. Older people often...Ch. 8.2 - Meal Cost in Hong Kong. The mean cost of a meal...Ch. 8.2 - Automobile Insurance Premiums. The average annual...Ch. 8.2 - Telemedicine. Health insurers are beginning to...Ch. 8.2 - Movie Ticket Sales. Marvel Studios motion picture...Ch. 8.3 - 23. How large a sample should be selected to...Ch. 8.3 - The range for a set of data is estimated to be 36....Ch. 8.3 - Refer to the Scheer Industries example in Section...Ch. 8.3 - Gasoline Prices. The U.S. Energy Information...Ch. 8.3 - Salaries of Business Graduates. Annual starting...Ch. 8.3 - 28. Many medical professionals believe that eating...Ch. 8.3 - 29. Customers arrive at a movie theater at the...Ch. 8.3 - Prob. 30ECh. 8.4 - A simple random sample of 400 individuals provides...Ch. 8.4 - A simple random sample of 800 elements generates a...Ch. 8.4 - In a survey, the planning value for the population...Ch. 8.4 - At 95% confidence, how large a sample should be...Ch. 8.4 - Health-Care Survey. In the spring of 2017, the...Ch. 8.4 - According to statistics reported on CNBC, a...Ch. 8.4 - Voter Sentiment. One of the questions Rasmussen...Ch. 8.4 - 38. According to Franchise business review, over...Ch. 8.4 - In 16% of all homes with a stay-at-home parent,...Ch. 8.4 - Prob. 40ECh. 8.4 - Driver’s License Rates. Fewer young people are...Ch. 8.4 - 42. A poll for the presidential campaign sampled...Ch. 8.4 - 43. The Pew Research Center Internet Project,...Ch. 8.5 - Federal Tax Return Errors. Suppose a sample of...Ch. 8.5 - Federal Government Employee Sick Hours. According...Ch. 8.5 - Web Browser Satisfaction. Internet users were...Ch. 8.5 - Speeding Drivers. In 2017, ABC News reported that...Ch. 8 - 44. A sample survey of 54 discount brokers showed...Ch. 8 - 45. A survey conducted by the American Automobile...Ch. 8 - 46. The 92 million Americans of age 50 and over...Ch. 8 - Healthy Sleep Duration. The Centers for Disease...Ch. 8 - The Health Care Cost Institute tracks health care...Ch. 8 - Obesity. Obesity is a risk factor for many health...Ch. 8 - Prob. 54SECh. 8 - 51. In developing patient appointment schedules, a...Ch. 8 - Prob. 56SECh. 8 - 53. The National Center for Education Statistics...Ch. 8 - A USA Today/CNN/Gallup survey of 369 working...Ch. 8 - Social Media Usage. The Pew Research Center has...Ch. 8 - Prob. 60SECh. 8 - The Centers for Disease Control reported the...Ch. 8 - A well-known bank credit card firm wishes to...Ch. 8 - Credit Card Ownership. Credit card ownership...Ch. 8 - 60. Although airline schedules and cost are...Ch. 8 - Driving Speeds. Huston Systems Private Limited...Ch. 8 - Prob. 66SECh. 8 - Prob. 67SECh. 8 - Prob. 68SECh. 8 - Young Professional Magazine Young Professional...Ch. 8 - Gulf Real Estate Properties Gulf Real Estate...Ch. 8 - Metropolitan Research, Inc.
Metropolitan Research,...
Knowledge Booster


Learn more about
Need a deep-dive on the concept behind this application? Look no further. Learn more about this topic, statistics and related others by exploring similar questions and additional content below.Similar questions
- Examine the Variables: Carefully review and note the names of all variables in the dataset. Examples of these variables include: Mileage (mpg) Number of Cylinders (cyl) Displacement (disp) Horsepower (hp) Research: Google to understand these variables. Statistical Analysis: Select mpg variable, and perform the following statistical tests. Once you are done with these tests using mpg variable, repeat the same with hp Mean Median First Quartile (Q1) Second Quartile (Q2) Third Quartile (Q3) Fourth Quartile (Q4) 10th Percentile 70th Percentile Skewness Kurtosis Document Your Results: In RStudio: Before running each statistical test, provide a heading in the format shown at the bottom. “# Mean of mileage – Your name’s command” In Microsoft Word: Once you've completed all tests, take a screenshot of your results in RStudio and paste it into a Microsoft Word document. Make sure that snapshots are very clear. You will need multiple snapshots. Also transfer these results to the…arrow_forward2 (VaR and ES) Suppose X1 are independent. Prove that ~ Unif[-0.5, 0.5] and X2 VaRa (X1X2) < VaRa(X1) + VaRa (X2). ~ Unif[-0.5, 0.5]arrow_forward8 (Correlation and Diversification) Assume we have two stocks, A and B, show that a particular combination of the two stocks produce a risk-free portfolio when the correlation between the return of A and B is -1.arrow_forward
- 9 (Portfolio allocation) Suppose R₁ and R2 are returns of 2 assets and with expected return and variance respectively r₁ and 72 and variance-covariance σ2, 0%½ and σ12. Find −∞ ≤ w ≤ ∞ such that the portfolio wR₁ + (1 - w) R₂ has the smallest risk.arrow_forward7 (Multivariate random variable) Suppose X, €1, €2, €3 are IID N(0, 1) and Y2 Y₁ = 0.2 0.8X + €1, Y₂ = 0.3 +0.7X+ €2, Y3 = 0.2 + 0.9X + €3. = (In models like this, X is called the common factors of Y₁, Y₂, Y3.) Y = (Y1, Y2, Y3). (a) Find E(Y) and cov(Y). (b) What can you observe from cov(Y). Writearrow_forward1 (VaR and ES) Suppose X ~ f(x) with 1+x, if 0> x > −1 f(x) = 1−x if 1 x > 0 Find VaRo.05 (X) and ES0.05 (X).arrow_forward
- Joy is making Christmas gifts. She has 6 1/12 feet of yarn and will need 4 1/4 to complete our project. How much yarn will she have left over compute this solution in two different ways arrow_forwardSolve for X. Explain each step. 2^2x • 2^-4=8arrow_forwardOne hundred people were surveyed, and one question pertained to their educational background. The results of this question and their genders are given in the following table. Female (F) Male (F′) Total College degree (D) 30 20 50 No college degree (D′) 30 20 50 Total 60 40 100 If a person is selected at random from those surveyed, find the probability of each of the following events.1. The person is female or has a college degree. Answer: equation editor Equation Editor 2. The person is male or does not have a college degree. Answer: equation editor Equation Editor 3. The person is female or does not have a college degree.arrow_forward
arrow_back_ios
SEE MORE QUESTIONS
arrow_forward_ios
Recommended textbooks for you
 Glencoe Algebra 1, Student Edition, 9780079039897...AlgebraISBN:9780079039897Author:CarterPublisher:McGraw Hill
 Big Ideas Math A Bridge To Success Algebra 1: Stu...AlgebraISBN:9781680331141Author:HOUGHTON MIFFLIN HARCOURTPublisher:Houghton Mifflin Harcourt
 Holt Mcdougal Larson Pre-algebra: Student Edition...AlgebraISBN:9780547587776Author:HOLT MCDOUGALPublisher:HOLT MCDOUGAL
Glencoe Algebra 1, Student Edition, 9780079039897...
Algebra
ISBN:9780079039897
Author:Carter
Publisher:McGraw Hill
Big Ideas Math A Bridge To Success Algebra 1: Stu...
Algebra
ISBN:9781680331141
Author:HOUGHTON MIFFLIN HARCOURT
Publisher:Houghton Mifflin Harcourt
Holt Mcdougal Larson Pre-algebra: Student Edition...
Algebra
ISBN:9780547587776
Author:HOLT MCDOUGAL
Publisher:HOLT MCDOUGAL
Which is the best chart: Selecting among 14 types of charts Part II; Author: 365 Data Science;https://www.youtube.com/watch?v=qGaIB-bRn-A;License: Standard YouTube License, CC-BY