
Videos
T-Maze Each day, mice are put into a T-maze (a maze shaped like a “T”; Fig. 7). In this maze, they have the choice of turning to the left (are rewarded with cheese) or to the right (receive cheese along with mild shock). After the first day, their decision whether to turn left or right is influenced by what happened on the previous day. Of those that go to the left on a certain day, 90% go to the left on the next day and 10% go to the right. Of those that go to the right on a certain day, 70% go to the left on the next day and 30% go to the right.
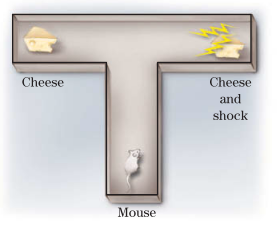
Figure 7
a. Set up the
b. Compute the second power of the matrix in part (a).
c. Suppose that, on the first day (day 0), 50% go to the left and 50% go to the right. So, the initial distribution is given by the column matrix
d. Make a guess as to the percentage of mice that will go to the left after 50 days. (Do not compute.)
Want to see the full answer?
Check out a sample textbook solution
Chapter 8 Solutions
Finite Mathematics & Its Applications (12th Edition)


- It is claimed that a vitamin supplement helps mice learn to run a maze more quickly and, in fact, to beat a non-treated mouse 70% of the time (whereas without the supplement, it would only win half of the time). To test this claim, you divide a group of 20 mice randomly into ten pairs, giving one of each pair the vitamin supplement. You run each pair through the maze and find that seven out of ten of the mice treated with the vitamin supplement beat the untreated mice. a) What is the probability of obtaining this result if the claim is true? b) What is the probability of obtaining this result if the claim is false (i.e., the supplement has no effect)? c) Suppose before you ran this experiment, you thought it was equally likely that the claim was true or false. After running the experiment, what is your belief? What is the updated probability?arrow_forwardItranscript One male and one female dam rat pup were randomly selected from 8 litters to perform the swim maze. Each pup was placed in the water at one end of the maze and allowed to swim until it escaped at the opposite end. If the pup failed to escape after a certain period of time, it was placed at the beginning of the maze and given another chance. The experiment was repeated until each pup accomplished three successful escapes. The table to the right reports the number of swims required by each pup. Is there sufficient evidence of a difference between the mean number of swims required by male and female pups? Use a=0.01. Comment on the assumptions required for the test to be valid. B. t> Litter 1 2 3 OC. t 10 12 Female 11 [6526675 10arrow_forward"Coffee drinkers often claim that the caffeine in the coffee makes them more alert. A researcher wonders if this enhanced alertness is merely an illusion or if caffeine actually makes people more alert. To test the effect of caffeine on alertness, the researcher asks people to drink one cup of caffeinated coffee, one cup of plain water, one cup of caffeinated water, or one cup of decaffeinated coffee. After drinking the beverage each participant was given an electroencephalogram (EEG). The researcher hypothesized that the caffeinated beverages would result in greater electrical activity than the non-caffeinated beverages. Which of the following would be most likely to increase the size of the treatment effect in this study? " Only use people in the study who are between the ages of 25 and 35 rather than 25 and 75. Increase the amount of beverage participants drink from one cup to two cups. Have experienced EEG technicians collect data rather than train students…arrow_forward
- Models a Footer 1.Suppose a study is done to examine the average hours per week all college studentsspent playing video games. A random sample of 1337 students gave an average of 18 hours perweek. Some spent this time engaged in an epic battle to defend their Ancient from the enemyheroes. Other students spent their time scavenging for weapons to help them survive in thebattlegrounds. Finally, there were those students who blew up imaginary candies and/or slicedimaginary fruit instead. (a) Identify the variable. (b) Is the variable quantitative or qualitative? (c) What is the implied population? 2. Categorize these measurements by to level: Nominal, Ordinal, Interval, or Ratio. (a) Temperature in degrees Celsius. (b) Flavors of Ben & Jerry's ice cream. (c) The number of movies a person has seen this year. 3. Suppose you are conducting a survey to determine how satisfied students are with theGreek life experience. In order to obtain an appropriate sample for a particular school…arrow_forwardMateo believes that completely cutting caffeine out of a person's diet will allow them more restful sleep at night. He randomly selects 8 adults to help him test this theory. Each person is asked to consume two caffeinated beverages per day for 28 days and then cut back to no caffeinated bevarages for an additional 28 days. During each period, the participants record the number of nights of restful sleep that they had. The following table gives the results of the study. Test Mateo's claim at the 0.05 level of significance. Give answers to 4 decimal places as needed. Number of Nights of Restful Sleep in a Four-Week Period 15 With Caffeine 21 20 22 24 18 21 24 20 26 26 22 21 23 27 23 Without Caffeine a) The normal probability plot showed the differences follow a normal distribution and the boxplot showed no outliers. b) Test the claim (1) Determine the null and alternative hypotheses. Enter correct symbol and values Ho: H₁: (2) Type of test: (3) a = (4) Test statistic (to) = p-value =…arrow_forwardA number generator was used to simulate the percentage of people in a town who ride a bike. The process simulates randomly selecting 100 people from the town and was repeated 20 times. The percentage of people who ride a bike is shown in the dot plot. 10 20 30 40 50 60 70 80 90 100 Which statement is true about the population of the town? O Most likely, 50% to 60% of the town rides a bike. O Most likely, 60% to 75% of the town rides a bike. O Most likely, 40% to 50% of the town rides a bike. O Most likely, 80% to 90% of the town rides a bike.arrow_forward
- Cooling down with a cold drink before exercise in the heat is believed to help an athlete perform. Researcher J. Dugas explored the difference between cooling down with an ice slurry (slushy) and with cold water. Ten male participants drank a flavored ice slurry and ran a treadmill in a controlled hot and humid environment. Days later, the same participants drank cold water and ran on a treadmill in the same hot and humid environment. The following table shows the times, in minutes, it took to fatigue on the treadmill for both the ice slurry and the cold water. Subject Cold Water 1 52 2 37 3 44 4 51 5 34 6 38 7 41 8 50 9 29 10 38 Ice Slurry 56, 43, 52, 58, 38, 45, 45, 58, 34, 44 find a 98% confidence interval for the differences between the mean times to fatigue on a treadmill in a hot and humid environment after cooling down with cold water and after cooling down with an ice slurry.arrow_forwardTwo different labs, Rodent Racers and Squeeky Labs, measured the time for mice to complete a maze. The results are summarized in the following two boxplots. Squeeky Labs 8 15 20 25 28 Rodent Racers + -5 15 20 20 10 15 25 28 20 25 Completion Time (a) Which lab contained more mice? Rodent Racers Squeeky Labs Not enough information to tell. 30 30 (b) Which lab had the smallest completion time? Rodent Racers Squeeky Labs Not enough information to tell. + 30 30 (c) According to range, which lab had the smallest variation (smallest spread) in completion time? Rodent Racers Squeeky Labs Not enough information to tell.arrow_forwardCooling down with a cold drink before exercise in the heat is believed to help an athlete perform. Researcher J. Dugas explored the difference between cooling down with an ice slurry (slushy) and with cold water. Ten male participants drank a flavored ice slurry and ran a treadmill in a controlled hot and humid environment. Days later, the same participants drank cold water and ran on a treadmill in the same hot and humid environment. The following table shows the times, in minutes, it took to fatigue on the treadmill for both the ice slurry and the cold water. Subject Cold Water 1 52 2 37 3 44 4 51 5 34 6 38 7 41 8 50 9 29 10. 38 Ice Slurry 56 43 52 58 38 45 45 58 34 44 At the 1% significance level, do the data provide sufficient evidence to conclude that, on average, cold water is less effective than ice slurry for optimizing athletic performance in the heat? (Note: the mean and standard deviation of the paired differences are – 5.9 and 1.60…arrow_forward
- You survey college bound and find that 85% plan to liv eon campus, 35% plan to have a car while at campus and 5% plan to live off campus and not have a car. Is there an association between living on campus and having a car at college?arrow_forwardA driver’s age has something to do with his or her chance of getting into a fatal car crash. The bar graph shows the number of fatal vehicle crashes per 100 million miles driven for drivers of various age groups. For example, 25-year-old drivers are involved in 4.1 fatal crashes per 100 million miles driven. Thus, when a group of 25-year-old Americans have driven a total of 100 million miles, approximately 4 have been in accidents in which someone died. The number of fatal vehicle crashes per 100 million miles, y, for drivers of age x can be modeled by the formula : y = 0.013x2 - 1.19x + 28.24. Use the formula above and the bar graph at the bottom of the previous page to solve, What age groups are expected to be involved in 10 fatal crashes per 100 million miles driven? How well does the formula model the trend in the actual data shown by the bar graph?arrow_forwardIndicate why the give method for running a simulation is not accurate.A bag contains 4 red marbles, 4 blue marbles, 6 yellow marbles, and 6 green marbles. If marbles are drawn one-by-one and not replaced, use 0-1 to represent a red marble, 2-3 to represent blue, 4-6 for yellow, and 7-9 to represent a green marble.arrow_forward
 Holt Mcdougal Larson Pre-algebra: Student Edition...AlgebraISBN:9780547587776Author:HOLT MCDOUGALPublisher:HOLT MCDOUGAL
 Glencoe Algebra 1, Student Edition, 9780079039897...AlgebraISBN:9780079039897Author:CarterPublisher:McGraw Hill