EBK INTRODUCTION TO THE PRACTICE OF STA
8th Edition
ISBN: 9781319116828
Author: Moore
Publisher: VST
bartleby

Concept explainers

bartleby

Videos

Question
Book Icon
Chapter 8, Problem 96E
To determine

To find: The 95% margin of error for the difference of two proportions for sample size n=60.

Expert Solution
Check Mark

Answer to Problem 96E

Solution: The margin of error is 0.1607.

Explanation of Solution

Calculation: The assumption made that the sample size n is the common value of n1and n2 and hence n1=60andn2=60. The margin of error is defined as:

m=z*×SED

Where, z* is the critical value for the standard normal variable and SED is the standard error of the difference. Also, the standard error of D is defined as:

SED=p^1(1p^1)n1+p^2(1p^2)n2

Where,

p^1=Sample proportion from population 1p^2=Sample proportion from population 2n1=Sample size of group 1n2=Sample size of group 2

Substitute the provided values p^1=0.8,p^2=0.6 and n1=60,n2=60 in the above defined formula to calculate the standard error of D.

SED=0.8×(10.8)60+0.6×(10.6)60=0.0027+0.004=0.082

The value of z* for 95% confidence level is z*=1.96 from the standard normal table. So, the margin of error is obtained as:

m=z*×SED^=1.96×0.082=0.1607

Therefore, the margin of error is obtained as 0.1607.

To determine

To find: The 95% margin of error for the difference of two proportions for sample size n=70.

Expert Solution
Check Mark

Answer to Problem 96E

Solution: The margin of error is 0.1482.

Explanation of Solution

Calculation: The assumption made that the sample size n is the common value of n1and n2 and hence n1=70,n2=70. The margin of error is defined as:

m=z*×SED

Where z* is the critical value for the standard normal variable and SED is the standard error of the difference. Also, the standard error of D is defined as:

SED=p^1(1p^1)n1+p^2(1p^2)n2

Where

p^1=Sample proportion from population 1p^2=Sample proportion from population 2n1=Sample size of group 1n2=Sample size of group 2

Substitute the provided values p^1=0.8,p^2=0.6 and n1=70,n2=70 in the above defined formula to calculate the standard error of D.

SED=0.8×(10.8)70+0.6×(10.6)70=0.0023+0.0034=0.0756

The value of z* for 95% confidence level is z*=1.96 from the standard normal table. So, the margin of error is obtained as:

m=z*×SED^=1.96×0.0756=0.1482

Therefore, the margin of error is obtained as 0.1482.

To determine

To find: The 95% margin of error for the difference of two proportions for sample size n=80.

Expert Solution
Check Mark

Answer to Problem 96E

Solution: The margin of error is 0.1386.

Explanation of Solution

Calculation: The assumption made that the sample size n is the common value of n1and n2 and hence n1=80andn2=80. The margin of error is defined as:

m=z*×SED

Where z* is the critical value for the standard normal variable and SED is the standard error of the difference. Also, the standard error of D is defined as:

SED=p^1(1p^1)n1+p^2(1p^2)n2

Where

p^1=Sample proportion from population 1p^2=Sample proportion from population 2n1=Sample size of group 1n2=Sample size of group 2

Substitute the provided values p^1=0.8,p^2=0.6 and n1=80,n2=80 in the above defined formula to calculate the standard error of D.

SED=0.8×(10.8)80+0.6×(10.6)80=0.0707

The value of z* for 95% confidence level is z*=1.96 from the standard normal table. So, the margin of error is obtained as:

m=z*×SED^=1.96×0.0707=0.1386

Therefore, the margin of error is obtained as 0.1386.

To determine

To find: The 95% margin of error for the difference of two proportions for sample size n=100.

Expert Solution
Check Mark

Answer to Problem 96E

Solution: The margin of error is 0.1239.

Explanation of Solution

Calculation: The assumption made that the sample size n is the common value of n1and n2 and hence n1=100andn2=100. The margin of error for confidence level C is defined as:

m=z*×SED

Where z* is the value for the standard normal density curve and SED is the standard error of the difference. Also, the standard error of D is defined as:

SED=p^1(1p^1)n1+p^2(1p^2)n2

Where

p^1=Sample proportion from population 1p^2=Sample proportion from population 2n1=Sample size of group 1n2=Sample size of group 2

Substitute the provided values p^1=0.8,p^2=0.6 and n1=100,n2=100 in the above defined formula to calculate the standard error of D.

SED=0.8×(10.8)100+0.6×(10.6)100=0.0632

The value of z* for 95% confidence level is z*=1.96 from the standard normal table. So, the margin of error is obtained as:

m=z*×SED^=1.96×0.0632=0.1239

Therefore, the margin of error is obtained as 0.1239.

To determine

To find: The 95% margin of error for the difference of two proportions for sample size n=400.

Expert Solution
Check Mark

Answer to Problem 96E

Solution: The margin of error is 0.0619.

Explanation of Solution

Calculation: The assumption made that the sample size n is the common value of n1and n2 and hence n1=400andn2=400. The margin of error is calculated as,

m=z*×SED

Where z* is the critical value for the standard normal variable and SED is the standard error of the difference. The standard error of D is defined as:

SED=p^1(1p^1)n1+p^2(1p^2)n2

Where

p^1=Sample proportion from population 1p^2=Sample proportion from population 2n1=Sample size of group 1n2=Sample size of group 2

Substitute the provided values p^1=0.8,p^2=0.6 and n1=400,n2=400 in the above defined formula to calculate the standard error of D.

SED=0.8×(10.8)80+0.6×(10.6)80=0.0316

The value of z* for 95% confidence level is z*=1.96 from the standard normal table. So, the margin of error is obtained as:

m=z*×SED^=1.96×0.0316=0.0619

Therefore, the margin of error is obtained as 0.0619.

To determine

To find: The 95% margin of error for the difference of two proportions for sample size n=500.

Expert Solution
Check Mark

Answer to Problem 96E

Solution: The margin of error is 0.0555.

Explanation of Solution

Calculation: The assumption made that the sample size n is the common value of n1and n2 and hence n1=500andn2=500. The margin of error for confidence level C is defined as:

m=z*×SED

Where z* is the critical value for the standard normal variable and SED is the standard error of the difference. The standard error of D is defined as:

SED=p^1(1p^1)n1+p^2(1p^2)n2

Where

p^1=Sample proportion from population 1p^2=Sample proportion from population 2n1=Sample size of group 1n2=Sample size of group 2

Substitute the provided values p^1=0.8,p^2=0.6 and n1=500,n2=500 in the above defined formula to calculate the standard error of D.

SED=0.8×(10.8)80+0.6×(10.6)80=0.0283

The value of z* for 95% confidence level is z*=1.96 from the standard normal table. So, the margin of error is obtained as:

m=z*×SED^=1.96×0.0283=0.0555

Therefore, the margin of error is obtained as 0.0555.

To determine

To find: The 95% margin of error for the difference of two proportions for sample size n=1000.

Expert Solution
Check Mark

Answer to Problem 96E

Solution: The margin of error is 0.0392.

Explanation of Solution

Calculation: The assumption made that the sample size n is the common value of n1and n2 and hence n1=1000andn2=1000. The margin of error is calculated as:

m=z*×SED

Where z* is the critical value for the standard normal variable and SED is the standard error of the difference. The standard error of D is defined as:

SED=p^1(1p^1)n1+p^2(1p^2)n2

Where

p^1=Sample proportion from population 1p^2=Sample proportion from population 2n1=Sample size of group 1n2=Sample size of group 2

Substitute the provided values p^1=0.8,p^2=0.6 and n1=1000,n2=1000 in the above defined formula to calculate the standard error of D.

SED=0.8×(10.8)80+0.6×(10.6)80=0.02

The value of z* for 95% confidence level is z*=1.96 from the standard normal table. So, the margin of error is obtained as:

m=z*×SED^=1.96×0.02=0.0392

Therefore, the margin of error is obtained as 0.0392.

To determine

The obtained results of margin of error for different sample sizes in a table.

Expert Solution
Check Mark

Answer to Problem 96E

Solution: The obtained results of 95% margins of error for different sample sizes are tabulated as:

N M
60 0.1607
70 0.1482
80 0.1386
100 0.1239
400 0.0619
500 0.0555
1000 0.0392

Explanation of Solution

The 95% margins of error for the difference between two proportions for different sample sizes are calculated as in the previous parts and are tabulated as:

N M
60 0.1607
70 0.1482
80 0.1386
100 0.1239
400 0.0619
500 0.0555
1000 0.0392

So, it is observed that with an increase in the sample size the margin of error reduces. Hence, a larger sample results in more accurate results.

To determine

To graph: The 95% margins of error obtained for different sample sizes.

Expert Solution
Check Mark

Explanation of Solution

Graph: To obtain the graph of 95% margins of error for different sample sizes, Minitab is used. The steps followed to construct the graph are:

Step 1: Enter the data of the sample sizes and the associated margins of error values in the worksheet.

Step 2: Select Graph→Scatterplot.

Step 3: Select Simple from the opened dialog and click on OK.

Step 4: Select the Y variables as margin of error column and X variable as sample size column and click on OK.

The graph is obtained as:

EBK INTRODUCTION TO THE PRACTICE OF STA, Chapter 8, Problem 96E

To determine

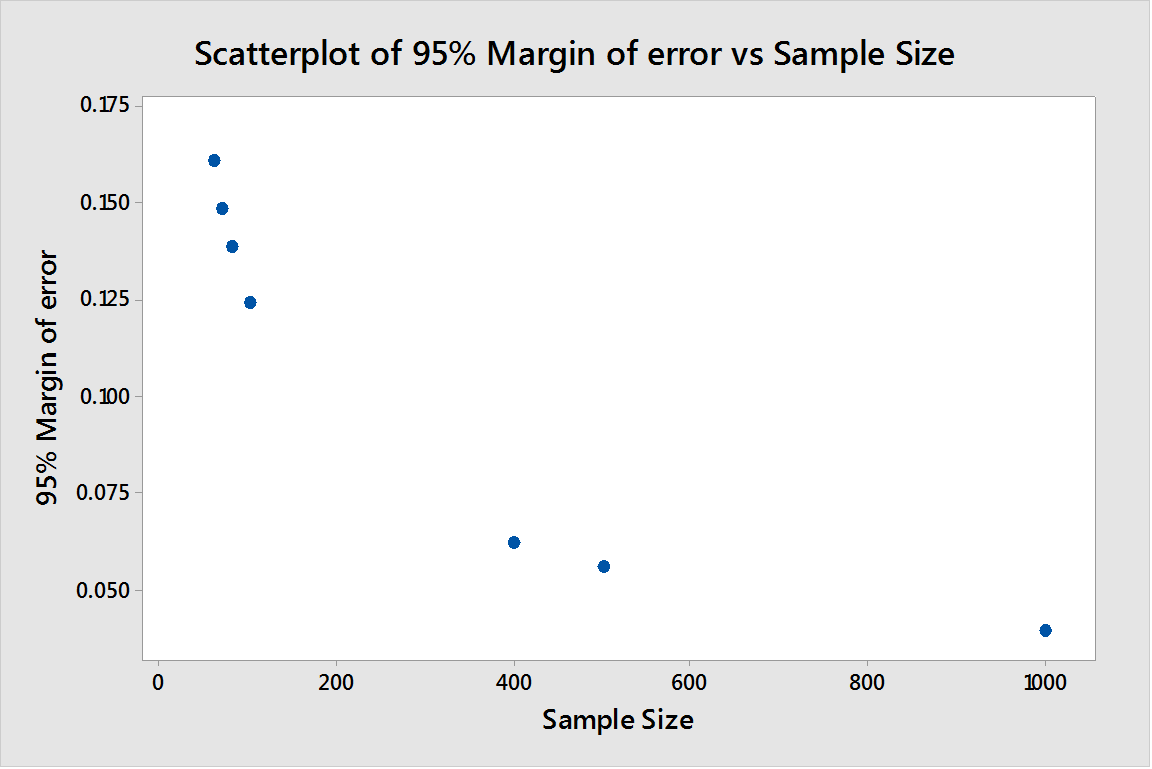
To explain: A short summary of the obtained results.

Expert Solution
Check Mark

Answer to Problem 96E

Solution: The obtained results of margins of error and the graph shows that the margin of error decreases as the sample size increases. But the rate of decrease of margin of error is very less for large n.

Explanation of Solution

The margins of error for different sample sizes are obtained and tabulated. The results show that the margin of error decreases as the sample size increases. This is also shown by the graph.

Hence, a larger sample is desirable for a lower error.

Want to see more full solutions like this?

Subscribe now to access step-by-step solutions to millions of textbook problems written by subject matter experts!

Chapter 8 Solutions

EBK INTRODUCTION TO THE PRACTICE OF STA

Ch. 8.1 - Prob. 11UYKCh. 8.1 - Prob. 12ECh. 8.1 - Prob. 13ECh. 8.1 - Prob. 14ECh. 8.1 - Prob. 15ECh. 8.1 - Prob. 16ECh. 8.1 - Prob. 17ECh. 8.1 - Prob. 18ECh. 8.1 - Prob. 19ECh. 8.1 - Prob. 20ECh. 8.1 - Prob. 21ECh. 8.1 - Prob. 22ECh. 8.1 - Prob. 23ECh. 8.1 - Prob. 24ECh. 8.1 - Prob. 25ECh. 8.1 - Prob. 26ECh. 8.1 - Prob. 27ECh. 8.1 - Prob. 28ECh. 8.1 - Prob. 29ECh. 8.1 - Prob. 30ECh. 8.1 - Prob. 31ECh. 8.1 - Prob. 32ECh. 8.1 - Prob. 33ECh. 8.1 - Prob. 34ECh. 8.1 - Prob. 35ECh. 8.1 - Prob. 37ECh. 8.1 - Prob. 39ECh. 8.1 - Prob. 40ECh. 8.1 - Prob. 41ECh. 8.1 - Prob. 42ECh. 8.1 - Prob. 43ECh. 8.1 - Prob. 44ECh. 8.1 - Prob. 36ECh. 8.1 - Prob. 38ECh. 8.2 - Prob. 45UYKCh. 8.2 - Prob. 46UYKCh. 8.2 - Prob. 47UYKCh. 8.2 - Prob. 48UYKCh. 8.2 - Prob. 49UYKCh. 8.2 - Prob. 50UYKCh. 8.2 - Prob. 51UYKCh. 8.2 - Prob. 52ECh. 8.2 - Prob. 53ECh. 8.2 - Prob. 54ECh. 8.2 - Prob. 55ECh. 8.2 - Prob. 56ECh. 8.2 - Prob. 57ECh. 8.2 - Prob. 58ECh. 8.2 - Prob. 59ECh. 8.2 - Prob. 60ECh. 8.2 - Prob. 61ECh. 8.2 - Prob. 62ECh. 8.2 - Prob. 63ECh. 8.2 - Prob. 64ECh. 8.2 - Prob. 65ECh. 8.2 - Prob. 66ECh. 8.2 - Prob. 67ECh. 8.2 - Prob. 69ECh. 8.2 - Prob. 68ECh. 8.2 - Prob. 70ECh. 8.2 - Prob. 71ECh. 8 - Prob. 72ECh. 8 - Prob. 73ECh. 8 - Prob. 74ECh. 8 - Prob. 75ECh. 8 - Prob. 76ECh. 8 - Prob. 77ECh. 8 - Prob. 94ECh. 8 - Prob. 79ECh. 8 - Prob. 80ECh. 8 - Prob. 81ECh. 8 - Prob. 82ECh. 8 - Prob. 83ECh. 8 - Prob. 84ECh. 8 - Prob. 85ECh. 8 - Prob. 86ECh. 8 - Prob. 87ECh. 8 - Prob. 88ECh. 8 - Prob. 89ECh. 8 - Prob. 90ECh. 8 - Prob. 95ECh. 8 - Prob. 96ECh. 8 - Prob. 97ECh. 8 - Prob. 98ECh. 8 - Prob. 99ECh. 8 - Prob. 92ECh. 8 - Prob. 93ECh. 8 - Prob. 78ECh. 8 - Prob. 100ECh. 8 - Prob. 101E
Knowledge Booster
Background pattern image
Statistics
Learn more about
Need a deep-dive on the concept behind this application? Look no further. Learn more about this topic, statistics and related others by exploring similar questions and additional content below.
Recommended textbooks for you
Text book image
Glencoe Algebra 1, Student Edition, 9780079039897...
Algebra
ISBN:9780079039897
Author:Carter
Publisher:McGraw Hill
Text book image
Calculus For The Life Sciences
Calculus
ISBN:9780321964038
Author:GREENWELL, Raymond N., RITCHEY, Nathan P., Lial, Margaret L.
Publisher:Pearson Addison Wesley,
Statistics 4.1 Point Estimators; Author: Dr. Jack L. Jackson II;https://www.youtube.com/watch?v=2MrI0J8XCEE;License: Standard YouTube License, CC-BY
Statistics 101: Point Estimators; Author: Brandon Foltz;https://www.youtube.com/watch?v=4v41z3HwLaM;License: Standard YouTube License, CC-BY
Central limit theorem; Author: 365 Data Science;https://www.youtube.com/watch?v=b5xQmk9veZ4;License: Standard YouTube License, CC-BY
Point Estimate Definition & Example; Author: Prof. Essa;https://www.youtube.com/watch?v=OTVwtvQmSn0;License: Standard Youtube License
Point Estimation; Author: Vamsidhar Ambatipudi;https://www.youtube.com/watch?v=flqhlM2bZWc;License: Standard Youtube License