1.
Compute estimated cost equation for delivery costs using high-low method.
1.
Explanation of Solution
Fixed Cost: Fixed cost refers the cost which remains constant for particular time duration and there is no effect on it of the level of production. For example, lease rental and interest on debts.
Compute variable cost.
Compute fixed cost.
Compute cost equation.
2.
Compute estimated cost equation for delivery costs using regression.
2.
Explanation of Solution
Summery output:
| Regression Statistics | |
| Multiple R | 0.910908263 |
| R square | 0.82975864 |
| Adjusted R square | 0.816658007 |
| Standard error | 9317.550058 |
| Observation | 15 |
Table (1)
| ANOVA | |||
| Particulars | df | SS | MS |
| Regression | 1 | 5500711165 | 5.50E+09 |
| Residual | 13 | 1128617608 | 86816739 |
| Total | 14 | 6629328773 | |
Table (2)
| Particulars | Coefficients | Standard error | t-star |
| Intercept | 18694.19925 | 19144.10277 | 0.976499 |
| Number of deliveries | 11.08553486 | 1.392672391 | 7.959901 |
Table (3)
Determine cost equation.
3.
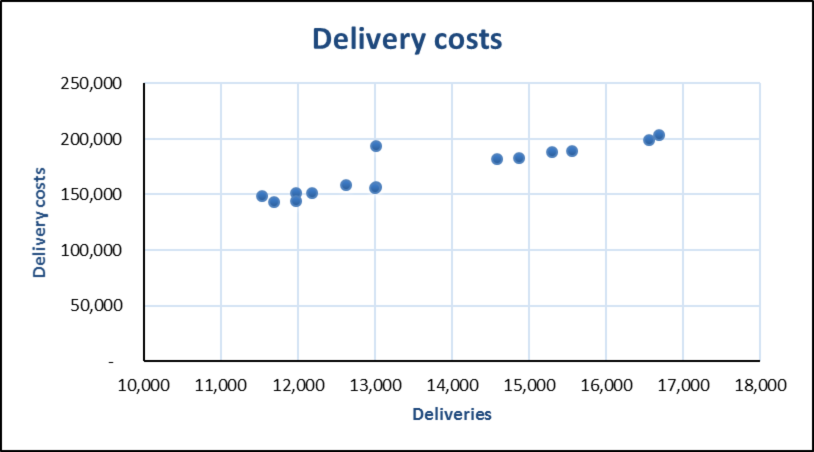
Draw a graph to compute adjustments made to the regression analysis made in part 2.
3.
Explanation of Solution
Draw a graph to compute adjustments.

Figure (1)
The graph shows that observation 8 is an outlier. There are changes for error in recording the data or something unusual happened during those period. In any event data point affects the predictive ability of the regression analysis.
4.
Explain the conclusion about various cost equation.
4.
Explanation of Solution
In case of error in the data, it has to be rectified and regression analysis has to be rerun. If the data are accurate then the observation 8 should be estimated and dropped and rerun the regression. The results dropping the outlier is shown below:
Summary output:
| Regression Statistics | |
| Multiple R | 0.989929239 |
| R square | 0.979959898 |
| Adjusted R square | 0.97828989 |
| Standard error | 3174.447074 |
| Observation | 14 |
Table (4)
| ANOVA | |||
| Particulars | df | SS | MS |
| Regression | 1 | 5913244065 | 5.50E+09 |
| Residual | 12 | 120925370.7 | 10077114 |
| Total | 13 | 6034169436 | |
Table (5)
| Particulars | Coefficients | Standard error | t-star |
| Intercept | 10183.34352 | 6577.604102 | 1.5481843 |
| Number of deliveries | 11.54822861 | 0.476727891 | 24.223942 |
Table (6)
Compute cost equation.
In summary, the cost equations are:
High-low:
Regression with all data:
Regression without observation 8.
The controller has to be careful about use of cost equation to estimate delivery costs in the future. While R-squared of the first regression is high, the R-squared of the regression without outlier is higher. In second regression also the t-value is higher.
Want to see more full solutions like this?
Chapter 8 Solutions
Cost Management
- Shorter company had originally expected to earn operating solve this question solutionarrow_forwardThe following is the post-closing trial balance for the Whitlow Manufacturing Corporation as of December 31, 2023. Account Title Debits Credits Cash $ 5,700 Accounts receivable 2,700 Inventory 5,700 Equipment 11,700 Accumulated depreciation $ 4,200 Accounts payable 3,700 Accrued liabilities 0 Common stock 9,000 Retained earnings 8,900 Sales revenue 0 Cost of goods sold 0 Salaries expense 0 Rent expense 0 Advertising expense 0 Dividends 0 Totals $ 25,800 $ 25,800 The following transactions occurred during January 2024: January 1 Sold inventory for cash, $4,200. The cost of the inventory was $2,700. The company uses the perpetual inventory system. January 2 Purchased equipment on account for $6,200 from the Strong Company. The full amount is due in 15 days. January 4 Received a $200 invoice from the local newspaper requesting payment for an advertisement that Whitlow placed in the paper on January 2. January 8…arrow_forwardThe following transactions occurred for the Microchip Company. On October 1, 2024, Microchip lent $80,000 to another company. A note was signed with principal and 6% interest to be paid on September 30, 2025. On November 1, 2024, the company paid its landlord $6,300 representing rent for the months of November through January. Prepaid rent was debited at the time of payment. On August 1, 2024, collected $12,300 in advance rent from another company that is renting a portion of Microchip’s factory. The $12,300 represents one year’s rent and the entire amount was credited to deferred rent revenue at the time cash was received. Depreciation on office equipment is $4,600 for the year. Vacation pay for the year that had been earned by employees but not paid to them or recorded is $8,100. The company records vacation pay as salaries expense. Microchip began the year with $2,100 in its asset account, supplies. During the year, $6,600 in supplies were purchased and debited to supplies. At…arrow_forward

 AccountingAccountingISBN:9781337272094Author:WARREN, Carl S., Reeve, James M., Duchac, Jonathan E.Publisher:Cengage Learning,
 Accounting Information SystemsAccountingISBN:9781337619202Author:Hall, James A.Publisher:Cengage Learning,
 Horngren's Cost Accounting: A Managerial Emphasis...AccountingISBN:9780134475585Author:Srikant M. Datar, Madhav V. RajanPublisher:PEARSON
 Intermediate AccountingAccountingISBN:9781259722660Author:J. David Spiceland, Mark W. Nelson, Wayne M ThomasPublisher:McGraw-Hill Education
 Financial and Managerial AccountingAccountingISBN:9781259726705Author:John J Wild, Ken W. Shaw, Barbara Chiappetta Fundamental Accounting PrinciplesPublisher:McGraw-Hill Education


