
Videos
To find: The box-plot for the four pollutants to verify that the assumptions for constructing a confidence interval are satisfied and the
Answer to Problem 4CS
The box-plot for the four pollutants is shown in Figure-1 and assumptions for constructing a confidence interval are satisfied and
Explanation of Solution
Given information:
The number of pollutants is
| Year 1 | Year 2 | ||||||
| PM | OC | TC | LE | PM | OC | TC | LE |
| 21.7 | 15.6 | 17.73 | 1.78 | 27.0 | 15.79 | 19.46 | 2.06 |
| 27.8 | 15.6 | 17.87 | 2.25 | 24.7 | 13.61 | 15.98 | 3.10 |
| 24.7 | 17.2 | 18.75 | 1.98 | 21.8 | 12.94 | 15.79 | 2.68 |
| 15.3 | 8.3 | 9.21 | 0.67 | 23.2 | 12.97 | 16.32 | 2.80 |
| 18.4 | 11.3 | 12.46 | 0.86 | 23.3 | I l.19 | 13.49 | 2.07 |
| 14.4 | 8.4 | 9.66 | 1.93 | 16.2 | 9.61 | 12.44 | 2.14 |
| 19.0 | 13.2 | 14.73 | 1.51 | 13.4 | 6.97 | 8.40 | 2.32 |
| 23.7 | 1 1.4 | 13.23 | 1.98 | 13.0 | 7.96 | 10.02 | 2. 18 |
| 22.4 | 13.8 | 17.08 | 1.69 | 16.9 | 8.43 | 11.08 | 2.06 |
| 25.6 | 13.2 | 15.86 | 2.30 | 26.3 | 14.92 | 21.46 | 1.94 |
| 15.0 | 15.7 | 17.27 | 1.24 | 31.4 | 17.15 | 20.57 | 1.85 |
| 17.0 | 9.3 | 10.2 1 | 1.44 | 40. l | 15.13 | 19.64 | 2. 1 1 |
| 23.2 | 10.5 | 11.47 | 1.43 | 28.0 | 8.66 | 10.75 | 2.50 |
| 17.7 | 14.2 | 15.64 | 1.07 | 4.2 | 15.95 | 20.36 | 2.27 |
| 11.l | 11.6 | 13.48 | 0.59 | 15.9 | 11.73 | 14.59 | 2.17 |
| 29.8 | 7.0 | 7.795 | 2.10 | 20.5 | 14.34 | 17.64 | 2.74 |
| 20.0 | 19.9 | 21.20 | 1.73 | 23.8 | 8.99 | 1 1.75 | 2.45 |
| 21.6 | 14.8 | 15.65 | 1.56 | 14.6 | 10.63 | 13.12 | |
| 14.8 | 12.6 | 13.51 | 1.1 | 17.8 | |||
| 21.0 | 9.1 | 9.94 | |||||
Concept used:
MINITAB is used.
Calculation:
The procedure for box-plot is, choose graph then box-plot, under the multiple Y’s choose simple and click ok.
In graph variables, enter the data of PM, OC, TC and LE and click ok.
The Box-plot is shown below.
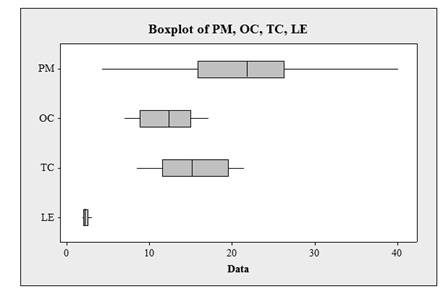
Figure-1
From Figure-1, there is no sign of strong skews and no outliers.
The
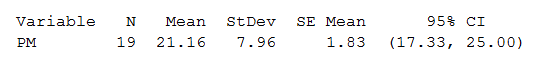
Figure-2
The
The
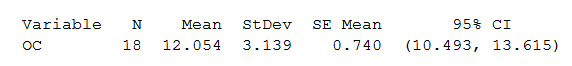
Figure-3
The
The
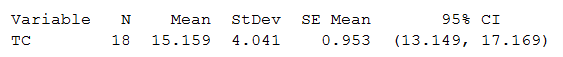
Figure-4
The
The
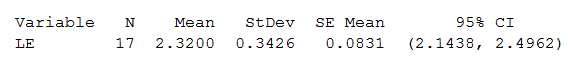
Figure-5
The
Therefore, the box-plot for the four pollutants is shown in Figure-1 and assumptions for constructing a confidence interval are satisfied and
Want to see more full solutions like this?
Chapter 8 Solutions
ELEM.STATS>LL<W/CONNECT-FD


- Table 6 shows the year and the number ofpeople unemployed in a particular city for several years. Determine whether the trend appears linear. If so, and assuming the trend continues, in what year will the number of unemployed reach 5 people?arrow_forwardFind the mean hourly cost when the cell phone described above is used for 240 minutes.arrow_forward
 Glencoe Algebra 1, Student Edition, 9780079039897...AlgebraISBN:9780079039897Author:CarterPublisher:McGraw Hill
 Holt Mcdougal Larson Pre-algebra: Student Edition...AlgebraISBN:9780547587776Author:HOLT MCDOUGALPublisher:HOLT MCDOUGAL
 College Algebra (MindTap Course List)AlgebraISBN:9781305652231Author:R. David Gustafson, Jeff HughesPublisher:Cengage Learning
 Algebra: Structure And Method, Book 1AlgebraISBN:9780395977224Author:Richard G. Brown, Mary P. Dolciani, Robert H. Sorgenfrey, William L. ColePublisher:McDougal Littell