
Intro Stats, Books a la Carte Edition (5th Edition)
5th Edition
ISBN: 9780134210285
Author: Richard D. De Veaux, Paul Velleman, David E. Bock
Publisher: PEARSON
expand_more
expand_more
format_list_bulleted
Concept explainers
Videos
Textbook Question
Chapter 8, Problem 43E
TBill rates 2016 revisited In Exercise 41, you investigated the federal rate on 3-month Treasury bills between 1950 and 1980. The
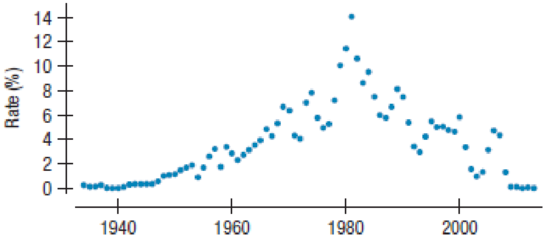
Here’s the model for the data from 1981 to 2015 (in years since 1950):
Dependent variable is Rate
R-squared = 79.1% s = 1.584
| Variable | Coefficient |
| Intercept | 8.5922 |
| Year – 1950 | –0.29646 |
- a) How does this model compare to the one in Exercise 41?
- b) What does this model estimate the interest rate will be in 2020? How does this compare to the rate you predicted in Exercise 41?
- c) Do you trust this newer predicted value? Explain.
- d) Would you use either of these models to predict the TBill rate in the future? Explain.
Expert Solution & Answer
Want to see the full answer?
Check out a sample textbook solution
Chapter 8 Solutions
Intro Stats, Books a la Carte Edition (5th Edition)
Ch. 8.3 - Each of these scatterplots shows an unusual point....Ch. 8.3 - Prob. 2JCCh. 8.3 - Prob. 3JCCh. 8.7 - Prob. 4JCCh. 8.7 - Prob. 5JCCh. 8.7 - Prob. 6JCCh. 8 - Credit card spending An analysis of spending by a...Ch. 8 - Prob. 2ECh. 8 - Prob. 3ECh. 8 - Prob. 4E
Ch. 8 - Prob. 5ECh. 8 - Prob. 6ECh. 8 - Prob. 7ECh. 8 - Prob. 8ECh. 8 - Prob. 9ECh. 8 - Prob. 10ECh. 8 - Skinned knees There is a strong correlation...Ch. 8 - Prob. 12ECh. 8 - Prob. 13ECh. 8 - Average GPA An athletic director proudly states...Ch. 8 - Prob. 15ECh. 8 - Prob. 16ECh. 8 - BK protein Recall the data about the Burger King...Ch. 8 - Prob. 18ECh. 8 - Prob. 19ECh. 8 - Prob. 20ECh. 8 - Prob. 21ECh. 8 - Prob. 22ECh. 8 - Prob. 23ECh. 8 - Prob. 24ECh. 8 - Good model? In justifying his choice of a model, a...Ch. 8 - Prob. 26ECh. 8 - Movie dramas Heres a scatterplot of the production...Ch. 8 - Prob. 28ECh. 8 - Oakland passengers 2016 The scatterplot below...Ch. 8 - Prob. 30ECh. 8 - Unusual points Each of these four scatterplots...Ch. 8 - More unusual points Each of the following...Ch. 8 - Prob. 33ECh. 8 - Prob. 34ECh. 8 - Prob. 35ECh. 8 - Whats the effect? A researcher studying violent...Ch. 8 - Reading To measure progress in reading ability,...Ch. 8 - Prob. 38ECh. 8 - Heating After keeping track of his heating...Ch. 8 - Speed How does the speed at which you drive affect...Ch. 8 - Prob. 41ECh. 8 - Prob. 42ECh. 8 - TBill rates 2016 revisited In Exercise 41, you...Ch. 8 - Prob. 44ECh. 8 - Prob. 45ECh. 8 - Prob. 46ECh. 8 - Elephants and hippos We removed humans from the...Ch. 8 - Prob. 48ECh. 8 - Prob. 49ECh. 8 - Prob. 50ECh. 8 - Prob. 51ECh. 8 - Prob. 52ECh. 8 - Inflation 2016 The Consumer Price Index (CPI)...Ch. 8 - Prob. 54ECh. 8 - Prob. 55ECh. 8 - Prob. 56ECh. 8 - Prob. 57ECh. 8 - Prob. 58ECh. 8 - Prob. 59ECh. 8 - Prob. 60ECh. 8 - Prob. 61ECh. 8 - Prob. 62ECh. 8 - Prob. 63ECh. 8 - Boyle Scientist Robert Boyle examined the...Ch. 8 - Brakes The following table shows stopping...Ch. 8 - Pendulum A student experimenting with a pendulum...Ch. 8 - Planets Here is a table of the 9 sun-orbiting...Ch. 8 - Is Pluto a planet? Lets look again at the pattern...Ch. 8 - Planets and asteroids The asteroid belt between...Ch. 8 - Prob. 71ECh. 8 - Prob. 72ECh. 8 - Logs (not logarithms) The value of a log is based...Ch. 8 - Prob. 74ECh. 8 - Life expectancy history The table gives the Life...Ch. 8 - Prob. 76ECh. 8 - Prob. 77ECh. 8 - Prob. 78ECh. 8 - Prob. 79ECh. 8 - Prob. 80E
Knowledge Booster


Learn more about
Need a deep-dive on the concept behind this application? Look no further. Learn more about this topic, statistics and related others by exploring similar questions and additional content below.Recommended textbooks for you
 MATLAB: An Introduction with ApplicationsStatisticsISBN:9781119256830Author:Amos GilatPublisher:John Wiley & Sons Inc
 Probability and Statistics for Engineering and th...StatisticsISBN:9781305251809Author:Jay L. DevorePublisher:Cengage Learning
 Statistics for The Behavioral Sciences (MindTap C...StatisticsISBN:9781305504912Author:Frederick J Gravetter, Larry B. WallnauPublisher:Cengage Learning
 Elementary Statistics: Picturing the World (7th E...StatisticsISBN:9780134683416Author:Ron Larson, Betsy FarberPublisher:PEARSON
 The Basic Practice of StatisticsStatisticsISBN:9781319042578Author:David S. Moore, William I. Notz, Michael A. FlignerPublisher:W. H. Freeman
 Introduction to the Practice of StatisticsStatisticsISBN:9781319013387Author:David S. Moore, George P. McCabe, Bruce A. CraigPublisher:W. H. Freeman
MATLAB: An Introduction with Applications
Statistics
ISBN:9781119256830
Author:Amos Gilat
Publisher:John Wiley & Sons Inc
Probability and Statistics for Engineering and th...
Statistics
ISBN:9781305251809
Author:Jay L. Devore
Publisher:Cengage Learning
Statistics for The Behavioral Sciences (MindTap C...
Statistics
ISBN:9781305504912
Author:Frederick J Gravetter, Larry B. Wallnau
Publisher:Cengage Learning
Elementary Statistics: Picturing the World (7th E...
Statistics
ISBN:9780134683416
Author:Ron Larson, Betsy Farber
Publisher:PEARSON
The Basic Practice of Statistics
Statistics
ISBN:9781319042578
Author:David S. Moore, William I. Notz, Michael A. Fligner
Publisher:W. H. Freeman
Introduction to the Practice of Statistics
Statistics
ISBN:9781319013387
Author:David S. Moore, George P. McCabe, Bruce A. Craig
Publisher:W. H. Freeman
Correlation Vs Regression: Difference Between them with definition & Comparison Chart; Author: Key Differences;https://www.youtube.com/watch?v=Ou2QGSJVd0U;License: Standard YouTube License, CC-BY
Correlation and Regression: Concepts with Illustrative examples; Author: LEARN & APPLY : Lean and Six Sigma;https://www.youtube.com/watch?v=xTpHD5WLuoA;License: Standard YouTube License, CC-BY