
Videos
Select a random sample of 15 individuals and test one or more of the hypotheses in Exercise 1 by using the t test. Use α = 0.05.
The Data Bank is found in Appendix B, or on the World Wide Web by following links from www.mhhe.com/math/stats/bluman/
1. From the Data Bank, select a random sample of at least 30 individuals, and test one or more of the following hypotheses by using the z test. Use α = 0.05.
a. For serum cholesterol, H0: μ = 220 milligram percent (mg%). Use σ = 5.
b. For systolic pressure, H0: μ = 120 millimeters of mercury (mm Hg). Use σ = 13.
c. For IQ, H0: μ = 100. Use σ = 15.
d. For sodium level, H0: μ = 140 milliequivalents per liter (mEq/l). Use σ = 6.
a.
To test: The claim that H0:μ=220.
Answer to Problem 2DA
The conclusion is that there is sufficient evidence to infer that the average serum cholesterol level is 220 milligram percent (mg%).
Explanation of Solution
Answer will vary. One of the possible answers is given below:
Given info:
Claim: H0:μ=220, n=15 and α=0.05.
Calculation:
State the null and alternative hypotheses:
Null hypothesis:
H0:μ=220
Alternative hypothesis:
H1:μ≠220
Test statistic value and P-value:
Software procedure:
Step by step procedure to obtain the test value using the MINITAB software:
- Choose Stat > Basic Statistics > 1-Sample t.
- In Samples in Column, enter the column of Serum cholesterol.
- In Perform hypothesis test, enter the test mean as 220.
- Check Options; enter Confidence level as 95%.
- Choose not equal in alternative.
- Click OK in all dialogue boxes.
Output using the MINITAB software is given below:
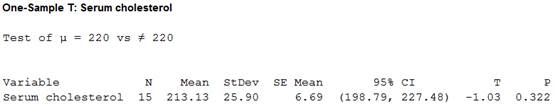
From the output, the test value is –1.03 and the P-value is 0.322.
Make the Decision:
Decision rule:
If P-value≤α, reject the null hypothesis
If P-value>α, do not reject the null hypothesis.
Here, the P-value is greater than the level of significance.
That is, P-value(=0.322)>α(=0.05).
By the decision rule, the null hypothesis is not rejected.
Thus, the decision is “fail to reject the null hypothesis”.
Summarize the result:
There is sufficient evidence to infer that the average serum cholesterol level is 220 milligram percent (mg%).
b.
To test: The claim that H0:μ=120.
Answer to Problem 2DA
The conclusion is that there is sufficient evidence to infer that the average systolic pressure is differs from 120 millimeters of mercury (mm Hg).
Explanation of Solution
Given info:
Claim: H0:μ=120, n=15 and α=0.05.
Calculation:
State the null and alternative hypotheses:
Null hypothesis:
H0:μ=120
Alternative hypothesis:
H1:μ≠120
Test statistic value and P-value:
Software procedure:
Step by step procedure to obtain the test value using the MINITAB software:
- Choose Stat > Basic Statistics > 1-Sample t.
- In Samples in Column, enter the column of Systolic pressure.
- In Perform hypothesis test, enter the test mean as 120.
- Check Options; enter Confidence level as 95%.
- Choose not equal in alternative.
- Click OK in all dialogue boxes.
Output using the MINITAB software is given below:
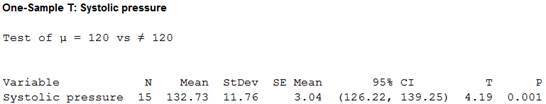
From the output, the test value is 4.19 and the P-value is 0.001.
Make the Decision:
Here, the P-value is lesser than the level of significance.
That is, P-value(=0.001)<α(=0.05).
By the decision rule, the null hypothesis is rejected.
Thus, the decision is “reject the null hypothesis”.
Summarize the result:
There is sufficient evidence to infer that the average systolic pressure is differs from 120 millimetres of mercury (mm Hg).
c.
To test: The claim that H0:μ=100.
Answer to Problem 2DA
The conclusion is that there is sufficient evidence to infer that the average IQ score is differs from 100.
Explanation of Solution
Given info:
Claim: H0:μ=100, n=15 and α=0.05.
Calculation:
State the null and alternative hypotheses:
Null hypothesis:
H0:μ=100
Alternative hypothesis:
H1:μ≠100
Test statistic value and P-value:
Software procedure:
Step by step procedure to obtain the test value using the MINITAB software:
- Choose Stat > Basic Statistics > 1-Sample t.
- In Samples in Column, enter the column of IQ.
- In Perform hypothesis test, enter the test mean as 100.
- Check Options; enter Confidence level as 95%.
- Choose not equal in alternative.
- Click OK in all dialogue boxes.
Output using the MINITAB software is given below:
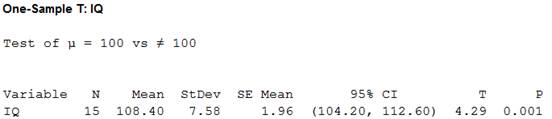
From the output, the test value is 4.29 and the P-value is 0.000.
Make the Decision:
Here, the P-value is lesser than the level of significance.
That is, P-value(=0.001)<α(=0.05).
By the decision rule, the null hypothesis is rejected.
Thus, the decision is “reject the null hypothesis”.
Summarize the result:
There is sufficient evidence to infer that the average IQ score is differs from 100.
d.
To test: The claim that H0:μ=140.
Answer to Problem 2DA
The conclusion is that there is sufficient evidence to infer that the average sodium level is 140.
Explanation of Solution
Given info:
Claim: H0:μ=140, n=15 and α=0.05.
Calculation:
State the null and alternative hypotheses:
Null hypothesis:
H0:μ=140
Alternative hypothesis:
H1:μ≠140
Test statistic value and P-value:
Software procedure:
Step by step procedure to obtain the test value using the MINITAB software:
- Choose Stat > Basic Statistics > 1-Sample t.
- In Samples in Column, enter the column of Sodium level.
- In Perform hypothesis test, enter the test mean as 140.
- Check Options; enter Confidence level as 95%.
- Choose not equal in alternative.
- Click OK in all dialogue boxes.
Output using the MINITAB software is given below:
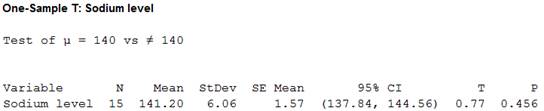
From the output, the test value is 0.77 and the P-value is 0.456.
Make the Decision:
Here, the P-value is greater than the level of significance.
That is, P-value(=0.456)>α(=0.05).
By the decision rule, the null hypothesis is not rejected.
Thus, the decision is “fail to reject the null hypothesis”.
Summarize the result:
There is sufficient evidence to infer that the average sodium level is 140.
Want to see more full solutions like this?
Chapter 8 Solutions
ALEK 360 ELEM STAT


- 11 Using the same toddler data, describe the toddlers with marginal probabilities only. BAY bit of benoliesmas (89 abje' jook stages of te cojota ing ou an out of to cojota ovig ber el ba 3+4=029arrow_forward21 Using the data from the table in Question 1, does the dominant hand differ for male toddlers versus female toddlers? (In other words, are these two events dependent?)arrow_forwardop In a two-way table with variables A and B, does P(A|B) + P(A|B) = 1? பே 69 6 work as m 3 atavs ow to portabagabat sot gaisarrow_forward
- In a two-way table with variables A and B, does P(A|B)+P(A|B)=1? dsins/Ispino936) 1 durab ALED a to gilidadost Earrow_forwardpreference are dependent (you even have to look at the males). Using the bumper sticker data in the first example problem in this chapter, are car age and number of bumper stickers related (In other words, are these two events dependent?) d insbusqabni oss agit ads bms gliw woy tadi validadong ada 15W wex s m ad ow MP gliw Boy 1st yilidadong at al terW .d Shsed smo viaxe 5X9 of pe 012 from 12 or to HOM qose Aunt swam to prepants M&arrow_forward23 வ dous biops Which marginal probabilities that you find in a two-way table should sum to 1? 著arrow_forward
- Using the toddler data from the table in Question 1 and appropriate probability notation, do the following: a. Compare the right-handed female and male toddlers in the sample, using condi- tional probabilities (only). b. Compare the right-handed toddlers asid in the sample, using conditional probabilities (only).dependent abni sis & bas bax bensqged snavs med) galworl andarrow_forwardUsing the toddler data from the table in Question 1 and appropriate probability notation, identify and calculate the following: a. What percentage of the male toddlers are right-handed? te b. What percentage of the female toddlers are right-handed? c. What percentage of the right-handed toddlers are male? d. What percentage of the right-handed toddlers are female?arrow_forward10 Using the toddler data from the table in Question 1 and the appropriate probability Tonotation, identify and calculate ther s following: a. What percentage of the toddlers are right-handed? b. now to What percentage of the toddlers are female? female? da boit vom wo c. What proportion of the toddlers are left-handed? d. What's the chance of finding a male toddler from the sample? [10arrow_forward
- 9 Using the car data from the bumper sticker table earlier in this chapter and the appro- priate probability notation, identify and calculate the following: a. What percentage of the cars are newer cars? b. What's the proportion of older cars? c. What percentage of the cars have a lot of bumper stickers? d. What's the probability that a car doesn't have a lot of bumper stickers?arrow_forwardSuppose that you roll a single die two times, and the trials are independent. What is the chance of rolling two 1s?arrow_forwardwwm popitisie w po qat al miscling s to muroging dW f 19 Satun If you find the joint probabilities for each of the cells in a two-way table, what should they sum to? EXC 61 (antillidsdong isoltitas sbby to combe Sto G1200arrow_forward
 College Algebra (MindTap Course List)AlgebraISBN:9781305652231Author:R. David Gustafson, Jeff HughesPublisher:Cengage Learning
 Holt Mcdougal Larson Pre-algebra: Student Edition...AlgebraISBN:9780547587776Author:HOLT MCDOUGALPublisher:HOLT MCDOUGAL
 Glencoe Algebra 1, Student Edition, 9780079039897...AlgebraISBN:9780079039897Author:CarterPublisher:McGraw Hill