Financial Accounting
14th Edition
ISBN: 9781305088436
Author: Carl Warren, Jim Reeve, Jonathan Duchac
Publisher: Cengage Learning
expand_more
expand_more
format_list_bulleted
Concept explainers
Videos
Textbook Question
Chapter 8, Problem 25E
Mattel, Inc., designs, manufactures, and markets toy products worldwide. Mattel’s toys include Barbie™ fashion dolls and accessories, Hot Wheels™, and Fisher-Price brands. For a recent year, Mattel reported the following net
Explain why Mattel reported negative net cash flows from operating activities during the second and third quarters and a large positive cash flow for the fourth quarter, with overall net positive cash flow for the year.
Expert Solution & Answer
Want to see the full answer?
Check out a sample textbook solution
Students have asked these similar questions
Determine the operating cash flow (OCF) for Ecualimentos S.A., based on the following data. (All
values are in thousands of dollars.). During the year the firm had sales of $2,500, cost of goods sold
totaled $1,800, operating expenses totaled $300, and depreciation expenses were $200. The firm
is in the 35% tax rate.
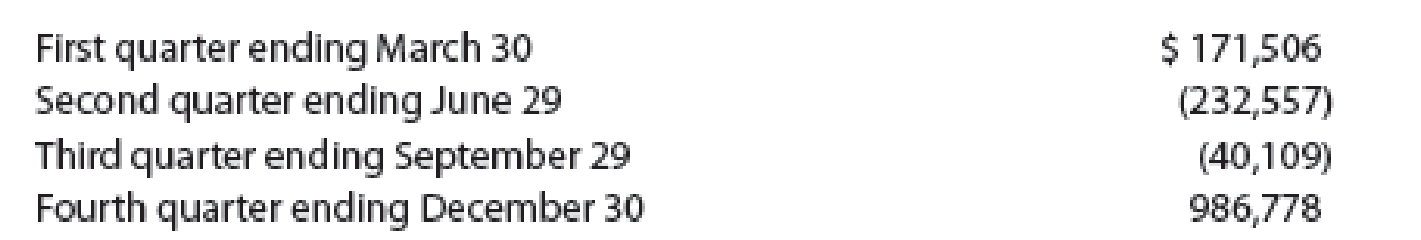
Mattel, Inc., designs, manufactures, and markets toy products worldwide. Mattel's toys include
Barbie® fashion dolls and accessories, Hot Wheels®, and Fisher-Price brands. For a recent
year, Mattel reported the following net cash flows from operating activities (in thousands):
$ (53,110)
First quarter ending March 31
Second quarter ending June 30
Third quarter ending September 30
Fourth quarter ending December 31
(187,663)
18,435
956,895
Explain why Mattel reported negative net cash flows from operating activi-
ties during the first and second quarters and a large positive cash flow for the fourth
quarter, with overall net positive cash flow for the year.
At one time, the Coca-Cola Company reported a number called” economic profit” that is very similar to residual operating income. It also reported free cash flow in its annual summary of selected financial data. The respective numbers for 1992-1999 are given below (in millions of dollars), along with what Coke calls total capital (similar to net operating assets) and return on total capital (similar to return on net operating assets):
1992
1993
1994
1995
1996
1997
1998
1999
Economic Profit
1300
1549
1896
2291
2718
3325
2480
1128
Free Cash Flow
873
1623
2146
2102
2413
3533
1876
2332
Total Capital
7095
7684
8744
9456
10669
11186
13552
15740
Return on Capital
29.40%
31.20%
32.70%
34.90%
36.70%
39.40%
30.20%
18.20%
a. Economic profit and free cash flow are similar, in most years, and their growth patterns are similar. Why?
b. Based on this past history, would you be indifferent in valuing Coke using discounted cash flow methods or residual operating income methods?
Chapter 8 Solutions
Financial Accounting
Ch. 8 - Prob. 1DQCh. 8 - Why should the employee who handles cash receipts...Ch. 8 - Prob. 3DQCh. 8 - Why should the responsibility for maintaining the...Ch. 8 - Assume that Brooke Miles, accounts payable clerk...Ch. 8 - Prob. 6DQCh. 8 - Prob. 7DQCh. 8 - Prob. 8DQCh. 8 - Prob. 9DQCh. 8 - Prob. 10DQ
Ch. 8 - Prob. 1PEACh. 8 - Prob. 1PEBCh. 8 - Prob. 2PEACh. 8 - Prob. 2PEBCh. 8 - Prob. 3PEACh. 8 - Prob. 3PEBCh. 8 - Prob. 4PEACh. 8 - Prob. 4PEBCh. 8 - Financial data for Otto Company follow: a....Ch. 8 - Prob. 5PEBCh. 8 - Prob. 1ECh. 8 - Prob. 2ECh. 8 - Prob. 3ECh. 8 - Pacific Bank provides loans to businesses in the...Ch. 8 - Prob. 5ECh. 8 - An employee of JHT Holdings, Inc., a trucking...Ch. 8 - Prob. 7ECh. 8 - Prob. 8ECh. 8 - Prob. 9ECh. 8 - Prob. 10ECh. 8 - Prob. 11ECh. 8 - Prob. 12ECh. 8 - Prob. 13ECh. 8 - Abbe Co. is a small merchandising company with a...Ch. 8 - Prob. 15ECh. 8 - Prob. 16ECh. 8 - Prob. 17ECh. 8 - Prob. 18ECh. 8 - Prob. 19ECh. 8 - Prob. 20ECh. 8 - Prob. 21ECh. 8 - Prob. 22ECh. 8 - Prob. 23ECh. 8 - Prob. 24ECh. 8 - Mattel, Inc., designs, manufactures, and markets...Ch. 8 - El Dorado Inc. has monthly cash expenses of...Ch. 8 - Prob. 27ECh. 8 - Amicus Therapeutics, Inc., is a biopharmaceutical...Ch. 8 - Prob. 1PACh. 8 - Cactus Restoration Company completed the following...Ch. 8 - Prob. 3PACh. 8 - Prob. 4PACh. 8 - Prob. 5PACh. 8 - Prob. 1PBCh. 8 - Cedar Springs Company completed the following...Ch. 8 - Prob. 3PBCh. 8 - Prob. 4PBCh. 8 - Prob. 5PBCh. 8 - During the preparation of the bank reconciliation...Ch. 8 - Prob. 2CPCh. 8 - Prob. 3CPCh. 8 - Prob. 4CPCh. 8 - Prob. 5CPCh. 8 - TearLab Corp. is a health care company that...
Knowledge Booster


Learn more about
Need a deep-dive on the concept behind this application? Look no further. Learn more about this topic, accounting and related others by exploring similar questions and additional content below.Similar questions
- Mattel, Inc., designs, manufactures, and markets toy products worldwide. Mattels toys include Barbie fashion dolls and accessories, Hot Wheels, and Fisher-Price brands. For a recent year, Mattel reported the following net cash flows from operating activities (in thousands): Explain why Mattel reported negative net cash flows from operating activities during the first and second quarters and a large positive cash flow for the fourth quarter, with overall net positive cash flow for the year.arrow_forwardThe management of ABC Company felt proud of their accomplishments concerning cash flow for the end of the year because overall cash increased by $1,500,000. In the operating section, the company showed an increase in cash of $250,000 because of net income. However, because of increases in accounts receivable and inventory, the overall cash outflow from operating activities was $100,000. In the investing section, purchases of long-term assets outweighed the sale of long-term assets which resulted in a cash outflow from investing activities of $500,000. The company has a line-of-credit with the bank. During the year, the company drew on the line which resulted in cash inflow from financing activities of $2,100,000. The cash inflow from financing activities of $2,100,000 less the cash outflow from operating activities of $100,000 and less the cash out flow from investing activities resulted in the overall cash increase of $1,500,000. Analyze the cash flows of ABC Company. What conclusions…arrow_forwardGeorgia Products Co. had the following positive cash flows during the current year: received cashfrom customers of $750,000; received bank loans of $35,000; and received cash from the sale ofcommon stock of $145,000. During the same year, cash was paid out to purchase inventory for$335,000, to employees for $230,000, and for the purchase of plant assets of $190,000. Calculatethe amount of cash provided by or used for operating activities by the direct method.arrow_forward
- Calculating Cash Flows. Titan Football Manufacturing had the following operating results for 2008: Sales = $18,450 Costs = $13,610 Depreciation expense = $2,420 Interest expense = $260 Dividends = $450. At the beginning of the year: Net fixed assets: $12,100 Current Assets: $3,020 Current Liabilities: $2,260 At the end of the year: Net fixed assets: $12,700 Current Assets: $4,690 Current Liabilities: $2,720 The tax rate for 2008 was 35 percent What is the net income for 2008? What is the operating cash flow for 2008? What is the cash flow from assets for 2008? Is this possible? Explain. If no new debt was issued during the year, what is the cash flow to creditors? What is the cash flow to stockholders? Explain and interpret the positive and negative signs of your answers in (a) through (e). Note: Please solve part 3.Explain and interpret the positive and negative signs of your answers in (a) through (e).arrow_forwardCalculating Cash Flows. Titan Football Manufacturing had the following operating results for 2008: Sales = $18,450 Costs = $13,610 Depreciation expense = $2,420 Interest expense = $260 Dividends = $450. At the beginning of the year: Net fixed assets: $12,100 Current Assets: $3,020 Current Liabilities: $2,260 At the end of the year: Net fixed assets: $12,700 Current Assets: $4,690 Current Liabilities: $2,720 The tax rate for 2008 was 35 percent What is the net income for 2008? What is the operating cash flow for 2008? What is the cash flow from assets for 2008? Is this possible? Explain. If no new debt was issued during the year, what is the cash flow to creditors? What is the cash flow to stockholders? Explain and interpret the positive and negative signs of your answers in (a) through (e).arrow_forwardAt the beginning of the year, National Corporation had P100,000 in cash. The company undertook a major expansion during this same year. Looking at its statement of cash flows, you see that the net cash provided by its operations was P350,000 and the company’s investing activities required cash expenditures of P800,000. The company’s cash position at the end of the year was P70,000. What was the net cash provided by the company’s financing activities?arrow_forward
- For the fiscal year just ended, Yoran Electronics had the following results: Net income 920,000; Depreciation expense 110,000; Increase in accounts payable 45,000; Increase in accounts receivable 73,000; Increase in marketable securities 40,000; Increase in deferred income tax liability 16,000; Decrease in Long-term debt 200,000. How much is the firm’s net cash flows from operating activities?arrow_forwardA business had a +10% variance in cash flow from investing activities this year as compared to last year. The dollar amount of cash flow from investing activities last year was $900,000. What was the dollar amount of cash flow from investing activities for this business in this year?arrow_forwardGraffiti Advertising, Inc., reported the following financial statements for the last two years. a. Calculate the operating cash flow. (Do not round intermediate calculations and round your answer to the nearest whole number, e.g., 32.) b.Calculate the change in net working capital. (Do not round intermediate calculations and round your answer to the nearest whole number, e.g., 32.) c. Calculate the net capital spending. (Do not round intermediate calculations and round your answer to the nearest whole number, e.g., 32.) d. Calculate the cash flow from assets. (A negative answer should be indicated by a minus sign. Do not round intermediate calculations and round your answer to the nearest whole number, e.g., 32.) e. Calculate the cash flow to creditors. (Do not round intermediate calculations and round your answer to the nearest whole number, e.g., 32.) f. Calculate the cash flow to stockholders. (A negative answer should be indicated by a minus sign. Do not round intermediate…arrow_forward
- Observe the following statement: STATEMENT OF CASH FLOW FOR “COUCH POTATO TECHNOLOGIES P/L” For the year ending June 30 2011 2010 $000 2011 $000 Receipts from customers (sales) 350 180 Payments for purchases 50 60 Payments to employees 80 80 Purchase of assets 10 20 Payments for operating expenses 10 15 Additional Information: • Industry Average Efficiency : 20% • Net profit in 2010 : $21 000 a) Define the term working capital. b) Comment on the cash flow of Couch Potato Technologies P/L in 2010. c) Calculate and comment on the efficiency of Couch Potato Technologies P/L d) Calculate and comment on the net profit of Couch Potato Technologies P/L. e) Recommend TWO strategies that can be used to manage the working capital of Couch Potato Technologies P/L.arrow_forwardKraft Inc, a retailer of dairy products, reported cost of goods sold for the year of $75 million. Total assets increased by $55 million, but inventory declined by $6 million. Total liabilities increased by $45 million, and accounts payable increased by $2 million. What is the cash paid by the company to its suppliers is most likely closest to:arrow_forwardYou are researching Time Manufacturing and have found the following accounting statement of cash flows for the most recent year. You also know that the company paid $98.9 million in current taxes and had an interest expense of $48.9 million. TIME MANUFACTURINGStatement of Cash Flows($ in millions) Operations Net income $ 182.0 Depreciation 94.9 Deferred taxes 19.9 Changes in assets and liabilities Accounts receivable – 18.9 Inventories 22.9 Accounts payable 17.9 Accrued expenses – 9.9 Other 3.9 Total cash flow from operations $ 312.7 Investing activities Acquisition of fixed assets –$ 206.0 Sale of fixed assets 23.9 Total cash flow from investing activities –$ 182.1 Financing activities Retirement of long-term debt –$ 171.0 Proceeds from long-term debt sales 128.0 Dividends – 95.0…arrow_forward
arrow_back_ios
SEE MORE QUESTIONS
arrow_forward_ios
Recommended textbooks for you
 Financial AccountingAccountingISBN:9781305088436Author:Carl Warren, Jim Reeve, Jonathan DuchacPublisher:Cengage Learning
 Financial AccountingAccountingISBN:9781337272124Author:Carl Warren, James M. Reeve, Jonathan DuchacPublisher:Cengage Learning
Financial Accounting
Accounting
ISBN:9781305088436
Author:Carl Warren, Jim Reeve, Jonathan Duchac
Publisher:Cengage Learning
Financial Accounting
Accounting
ISBN:9781337272124
Author:Carl Warren, James M. Reeve, Jonathan Duchac
Publisher:Cengage Learning
The KEY to Understanding Financial Statements; Author: Accounting Stuff;https://www.youtube.com/watch?v=_F6a0ddbjtI;License: Standard Youtube License