
Using Figure 8-2:
- a. Circle the area with the greatest pressure gradient.
- b. Use arrows to show the direction of pressure gradient force at a few locations. (These are typically drawn perpendicular to isobars.)
- c. Label a region where you would expect the lightest winds.
(a)
The area with the greatest pressure gradient in Figure 8-2 using circle.
Answer to Problem 1E
The map showing the area with the greatest pressure gradient is given below:
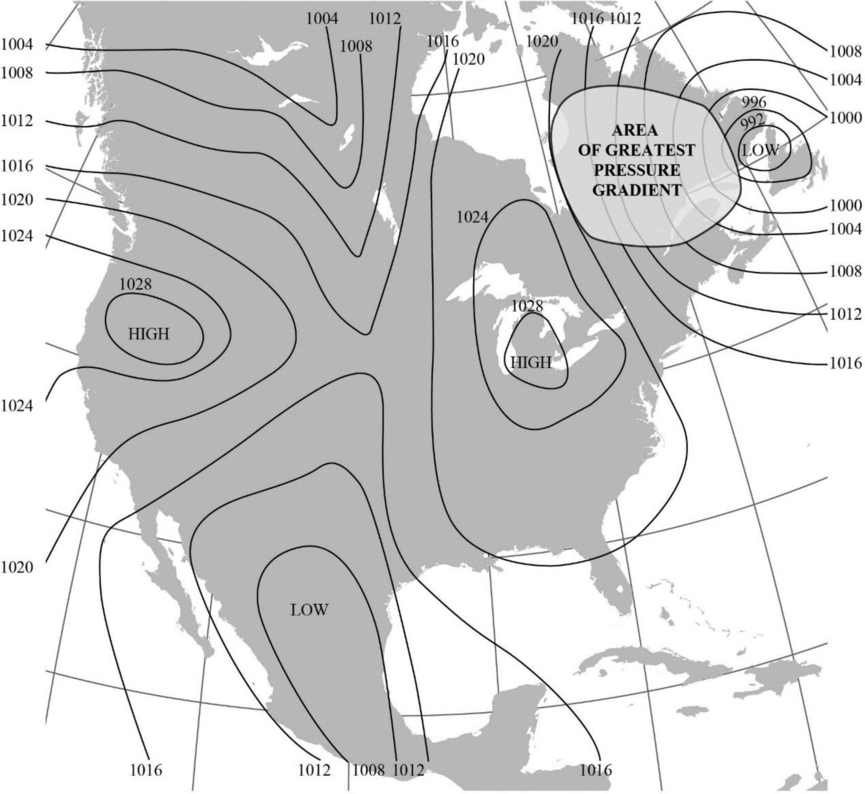
Explanation of Solution
“The magnitude of pressure gradient force is a function of the pressure difference between two points and air density.”
The map given in Figure 8-2 shows isobars, which are lines that connect areas with equal pressure. Closer isobars represent areas with higher pressure gradient. On the basis of this, the greatest pressure gradient is marked using a circle in the map towards the top right side of the Figure.
(b)
The direction of pressure gradient force at some locations in Figure 8-2 using arrows.
Answer to Problem 1E
The map with the direction of pressure gradient force at some locations indicated using arrows is shown below:
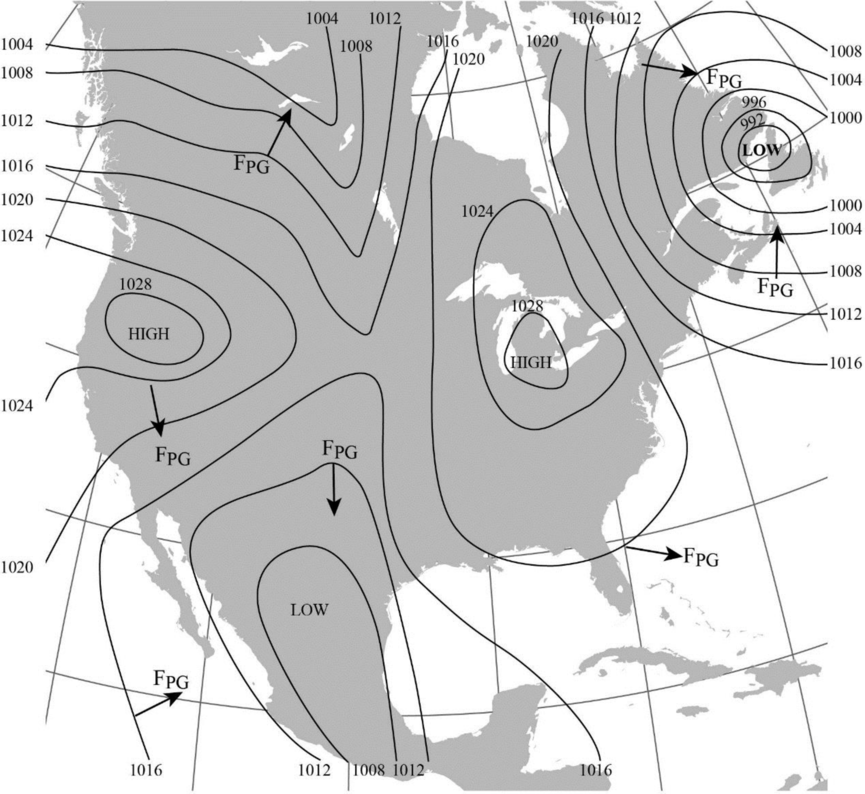
Explanation of Solution
The direction of pressure gradient force is usually drawn perpendicular to the isobars. The pressure gradient force is generally directed from the region of high pressure to lower pressure.
(c)
The region where the lightest winds are expected to occur in Figure 8-2.
Answer to Problem 1E
The area expected to experience the lightest winds is labelled in the map given below:
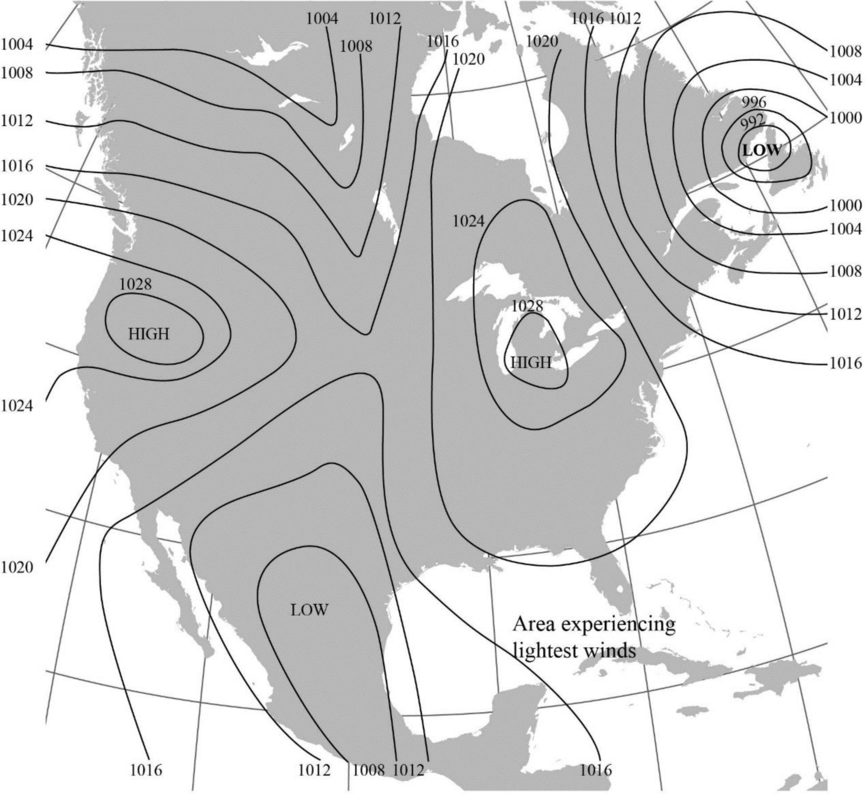
Explanation of Solution
The isobars that are widely-spaced generally denote a gradual pressure gradient and lighter winds whereas the closely-spaced isobars denote steep pressure gradient and stronger winds.
Want to see more full solutions like this?
Chapter 8 Solutions
EBK EXERCISES FOR WEATHER & CLIMATE
Additional Science Textbook Solutions
Introductory Chemistry (6th Edition)
Campbell Biology in Focus (2nd Edition)
Organic Chemistry (8th Edition)
Campbell Biology (11th Edition)
Microbiology: An Introduction
Chemistry: An Introduction to General, Organic, and Biological Chemistry (13th Edition)

- Using the map. Solve part e f garrow_forwardAnswer the below questions in detail using the attached pictures. Please ensure it is all 100% done by human, please do not use AI or chatgpt. using the provided hydraulic head data (attached spreadsheet), plot the values at their corresponding piezometer locations (attached piezometer map), contour the head data to create equipotential lines that allow you to demonstrate the groundwater flow direction, indicate the flow direction with arrows, provide comments/observations about the characteristics of the groundwater flow system, for example, are the equipotential lines equally spaced? If not, can you comment on why there are areas with close spacing and other areas with wide spacing? Are there any areas where the aquifer displays artesian conditions? If so, where?arrow_forwardPlease answer the question in detail. Please ensure it is 100% done by human, please do not use AI or chatgpt. Organize your spreadsheets carefully and make sure they are easy to follow. Make sure that your units are consistent, use SI units and make sure your graphs are clear and well labelled.arrow_forward
- Answer the below questions in detail using the attached pictures using the provided hydraulic head data (attached spreadsheet), plot the values at their corresponding piezometer locations (attached piezometer map), contour the head data to create equipotential lines that allow you to demonstrate the groundwater flow direction, indicate the flow direction with arrows, provide comments/observations about the characteristics of the groundwater flow system, for example, are the equipotential lines equally spaced? If not, can you comment on why there are areas with close spacing and other areas with wide spacing? Are there any areas where the aquifer displays artesian conditions? If so, where?arrow_forwardPlease answer the three questions in detail and as best as you can. plotting grain-size distribution curves from the grain data provided, calculating D10 values for each sample and using it to estimate the hydraulic conductivity, calculating the porosity for each sample Please ensure it is 100% done by human, please do not use AI or chatgpt.arrow_forwardPlease answer the question in detail. Please ensure it is 100% done by human, please do not use AI or chatgpt.arrow_forward
- Activity 9.4 Depositional Features of Glaciers Pg 158Use Figure 9.7, which illustrates a hypothetical retreating glacier, to complete the following. 1. As a glacier retreats, it sometimes stalls and deposits a recessional end moraine. Label the recessional end moraine on Figure 9.7. 2. On Figure 9.7, label an area covered by ground moraine. 3. On Figure 9.7, fill in the appropriate blanks with the names of the following depositional features: kettle lake, kame, drumlin, esker, and outwash plain. 4. Which area is composed of stratified drift: the ground moraine or the outwash plain? Activity 9.5 Depositional Features Associated with Ice Sheets Pgs 159-1611. After examining the map and stereogram, draw a line on the map to outline the area illustrated on the stereogram. 2. What evidence on the map indicates that portions of the area are poorly drained? On what part of the map are these features located? 3. Use Figure 9.11 to draw a topographic profile of the X-Y line on Figure 9.10.…arrow_forward3 1 O O O O Multiple Choice 1 point What is the geodesic distance between Fulton County Airport and the Toledo Express Airport? 27,301.7152 meters 25,923.833 meters 22, 743.621 meters 29,422.61 meters 2 Fill in the Blank 1 point How many airport complexes are in Cuyahoga County? type your answer.... Fill in the Blank 1 point How many airport complexes are in Mahoning County? type your answer... 4 Fill in the Blank 1 point If you lived in Uniopolis, OH, what airport complex would be the closest to you type your answer... two decimal points) type your answer... miles and how far away would it be? (Give this value in miles to -DOarrow_forwardproblem setarrow_forward
 Applications and Investigations in Earth Science ...Earth ScienceISBN:9780134746241Author:Edward J. Tarbuck, Frederick K. Lutgens, Dennis G. TasaPublisher:PEARSON
 Exercises for Weather & Climate (9th Edition)Earth ScienceISBN:9780134041360Author:Greg CarbonePublisher:PEARSON
 Environmental ScienceEarth ScienceISBN:9781260153125Author:William P Cunningham Prof., Mary Ann Cunningham ProfessorPublisher:McGraw-Hill Education
 Earth Science (15th Edition)Earth ScienceISBN:9780134543536Author:Edward J. Tarbuck, Frederick K. Lutgens, Dennis G. TasaPublisher:PEARSON
 Environmental Science (MindTap Course List)Earth ScienceISBN:9781337569613Author:G. Tyler Miller, Scott SpoolmanPublisher:Cengage Learning
 Physical GeologyEarth ScienceISBN:9781259916823Author:Plummer, Charles C., CARLSON, Diane H., Hammersley, LisaPublisher:Mcgraw-hill Education,