
a)
The graph of
a)
Explanation of Solution
The following graph of aggregate supply and demand shows an economy in long-run equilibrium:
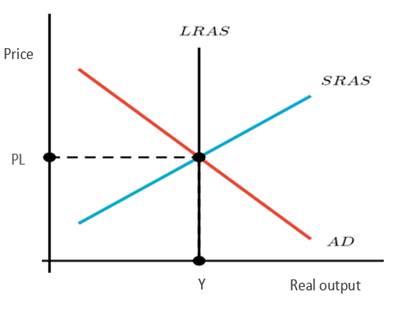
This graph shows real output on the horizontal axis and price on the vertical axis.
- The graph shows a price that is at equilibrium where demand and supply in the economy are equal. This point is labeled as PL.
- The
equilibrium quantity is on the horizontal axis which is labeled by Y. - A straight vertical line on the graph represents long-run aggregate supply which is labeled by LRAS where the economy is experiencing the supply in the long-run.
Introduction: The long run is the time span in
b)
The long-run equilibrium graph when the economy is experiencing
b)
Explanation of Solution
The graph will show the economic growth in long-run equilibrium as follows:
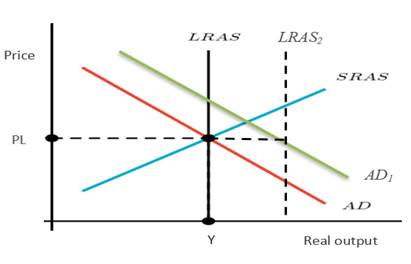
When there is an improvement in an economy's capacity to generate products and services over long-run, then the long-run
Introduction: The long run is the time span in macroeconomics during which the overall price level, wage rates, and expectations fully conform to the status of the economy.
Chapter 7R Solutions
Krugman's Economics For The Ap® Course


 Principles of Economics (12th Edition)EconomicsISBN:9780134078779Author:Karl E. Case, Ray C. Fair, Sharon E. OsterPublisher:PEARSON
 Engineering Economy (17th Edition)EconomicsISBN:9780134870069Author:William G. Sullivan, Elin M. Wicks, C. Patrick KoellingPublisher:PEARSON
 Principles of Economics (MindTap Course List)EconomicsISBN:9781305585126Author:N. Gregory MankiwPublisher:Cengage Learning
 Managerial Economics: A Problem Solving ApproachEconomicsISBN:9781337106665Author:Luke M. Froeb, Brian T. McCann, Michael R. Ward, Mike ShorPublisher:Cengage Learning
 Managerial Economics & Business Strategy (Mcgraw-...EconomicsISBN:9781259290619Author:Michael Baye, Jeff PrincePublisher:McGraw-Hill Education