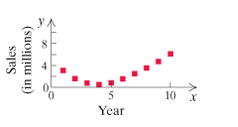
Choosing Models. For the
Linear,
Quadratic,
Quadratic,
Polynomial, neither quadratic nor linear.
Want to see the full answer?
Check out a sample textbook solutionChapter 7 Solutions
Math 030: Intermediate Algebra Orange Coast College
- Find the slope of the line containing each pair of points in Exercise 2. a 2,-3 and 2,5 c -4,1 and 4,5 b 3,-2 and -7,-2 d x-2,y-3 and x+4,y+5arrow_forwardSolve the problem. The data in the table represent the amount of raw material (in tons) put into an injection molding machine each day (x), and the amount of scrap plastic (in tons) that is collected from the machine every four weeks (y). Also shown below are the outputs from two different statistical technologies (TI-83/84 Calculator and Excel). A scatterplot of the data confirms that there is a linear association. Report the equation for predicting scrap from raw material using words such as scrap, not x and y. State the slope and intercept of the prediction equation. Round all calculations to the nearest hundredth. X y 2.71 3.61 2.33 2.80 2.33 2.77 2.21 2.34 2.11 2.15 2.08 2.06 1.98 1.95 1.84 1.84 2.02 1.95 1.73 1.68 LinReg y=a+bx a = -2.376991175 b=2.192699333 r² =.9806834986 P = .9902946524 Intercept X Variable 1 Coefficients -2.376991175 2.192699333 scrap = 2.19 -2.38(raw material); slope = 2.19 and the intercept is -2.38., scrap = -2.38 + 2.19(raw material); slope = -2.38 and…arrow_forwardToesdon 3: The U.S. Bureau of the Census predicted that the population of Florida would be about 16.4 million in 2010 and then would increase by about 0.35 million per year until 2015. Write a linear 201er that predicts the population, y, of Florida (in millions) in terms of x, the number of years since 2010. wurla Jaum uoY sod o no 2odunlo eniwollot orli storw Tedos A:l noltesuD vdw nisloxaarrow_forward
- Page of 11 ZOOM + 5. The table shows how the cost of a carne asada taco at my favorite taco stand has increased as they have become more popular since their opening in 2013. Use the data to answer the questions below. Year, x 2013, 0 2014, 1 2015, 2 2016, 3 2017, 4 2018, 5 2019,6 Cost ($) 0.50 0.55 0.65 0.75 0.90 1.00 1.10 (a) What is the regression line given by your TI-84 for this data? Round values to 3 decimal places. (b) Using the regression equation above, predict the cost of a carne asada taco at my favorite taco stand in 2020. Show the work.arrow_forwardThe table gives the average heights of children for ages 1 – 10, where x = the age (in years) and y = the height (in cm). Part a: Make a scatter plot and determine which type of model best fits the data.Part b: Find the regression equation.Part c: Can your equation be used to find the average height of a 20 year old? Explain.arrow_forwardRegression will show a in a broader sense. O a. Functional relationship O b. Partial relationship Oc. Impartial relationship O d. Managerial relationshiparrow_forward
- The electric power consumed each month by a chemical plant is thought to be related to the average ambient temperature (x₁), the number of days in the month (x₂), the average product purity (x3), and the tons of product produced (x4). The past year's historical data are available and are presented in the following table: Y 240 236 270 274 301 316 270 296 267 276 288 261 25 31 45 60 65 72 80 84 75 60 50 38 X2 24 21 24 25 25 26 25 25 24 25 25 23 Fit a multiple linear regression to predict power (y) using x1, X2 X3, and X4. Calculate R2 for this model. Round your answer to 3 decimal places. 91 90 88 87 91 94 87 86 88 91 90 89 X4 100 95 110 88 94 99 97 96 110 105 100 98arrow_forwardSoutherly Showtime Movie Theaters, Inc. owns and operates a chain of cinemas in several markets in the southern United States. The owners would like to estimate weekly gross revenue as a function of advertising expenditures. Data for a sample of eight markets for a recent week follow. (Let x1 represent Television Advertising ($100s), x2 represent Newspaper Advertising ($100s), and y represent Weekly Gross Revenue ($100s).) Market Weekly Gross Revenue ($100s) Television Advertising ($100s) Newspaper Advertising ($100s) Market 1 101.3 4.9 1.4 Market 2 51.9 2.9 3.1 Market 3 74.8 3.9 1.4 Market 4 126.2 4.4 4.2 Market 5 137.8 3.7 3.9 Market 6 101.4 3.4 2.4 Market 7 237.8 5.1 8.5 Market 8 219.6 7.0 5.7 (a) Develop an estimated linear regression equation with the amount of television advertising as the independent variable. (Round your numerical values to four decimal places.) ŷ = Test for a significant relationship between the amount spent on television…arrow_forwardThe amount of time adults spend watching television is closely monitored by firms because this helps to determine advertising pricing for commercials. Complete parts (a) through (d). (a) Do you think the variable "weekly time spent watching television" would be normally distributed? If not, what shape would you expect the variable to have? OA. The variable "weekly time spent watching television" is likely normally distributed. OB. The variable "weekly time spent watching television" is likely symmetric, but not normally distributed. OC. The variable "weekly time spent watching television" is likely uniform, not normally distributed. O D. The variable "weekly time spent watching television" is likely skewed left, not normally distributed. O E. The variable "weekly time spent watching television" is likely skewed right, not normally distributed. (b) According to a certain survey, adults spend 2.25 hours per day watching television on a weekday. Assume that the standard deviation for…arrow_forward
- City Hall wishes to learn about the rate of parking mater use. They choose 8 Downton blocks at random and on each block they choose 5 meters at random. Six weeks are chosen randomly from the year, and the usage on each meter is measured everyday for all the meters in those weeks.Write out an appropriate linear modelarrow_forwardShow all workarrow_forwardI need the answer of the question attached.. Thanks!arrow_forward
- Algebra & Trigonometry with Analytic GeometryAlgebraISBN:9781133382119Author:SwokowskiPublisher:CengageLinear Algebra: A Modern IntroductionAlgebraISBN:9781285463247Author:David PoolePublisher:Cengage Learning
- Elementary Geometry For College Students, 7eGeometryISBN:9781337614085Author:Alexander, Daniel C.; Koeberlein, Geralyn M.Publisher:Cengage,Holt Mcdougal Larson Pre-algebra: Student Edition...AlgebraISBN:9780547587776Author:HOLT MCDOUGALPublisher:HOLT MCDOUGAL