
a)
The correctly labeled graph shows a natural
a)
Explanation of Solution
The graph will show the data as follows:
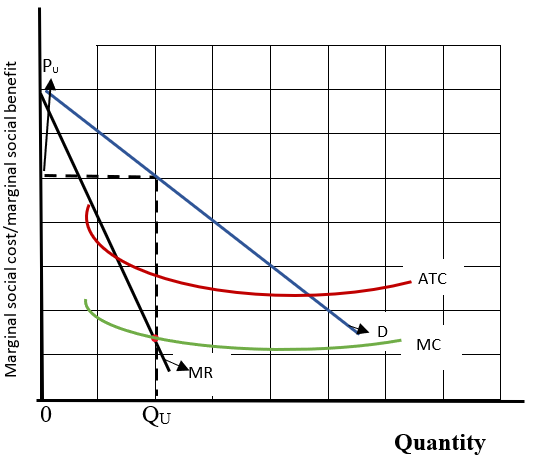
Price is represented in the vertical axis of the graph and quantity is shown on the horizontal axis of the graph. Here, the
The unregulated QU is represented at the point of QU on the horizontal axis where MC and MR are equal and the unregulated PU is found above QU at the vertical axis on a demand curve which is in a downward slope.
Introduction: A natural monopoly is a market structure that occurred when the start-up cost is high or there is a high administrative cost and the need for powerful economies of scale to conduct the business.
b)
The
b)
Explanation of Solution
The graph will show the data as follows:
0 QU
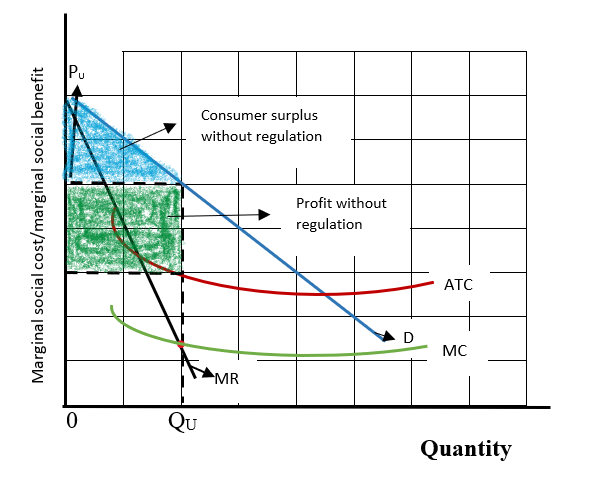
Price is represented in the vertical axis of the graph and quantity is shown on the horizontal axis of the graph. Here, the average total cost curve is in a downward slope whereas the marginal cost curve is also in a downward slope but it is below the ATC curve.
The unregulated QU is represented at the point of QU on the horizontal axis where MC and MR are equal and the unregulated PU is found above QU at the vertical axis on a demand curve which is in a downward slope.
Consumer surplus without regulation is shown as a triangular shaded area of grey color which is below the demand curve but above the price. The profit of the firm without regulation is found as a correct rectangular shaded area in blue color.
Introduction: A natural monopoly is a market structure that occurred when the start-up cost is high or there is high administrative cost and the need for powerful economies of scale to conduct the business.
c)
The lowest price that regulators could expect the monopoly to maintain in the long run as PR and Quantity as QR
c)
Explanation of Solution
The graph will show the data as follows:
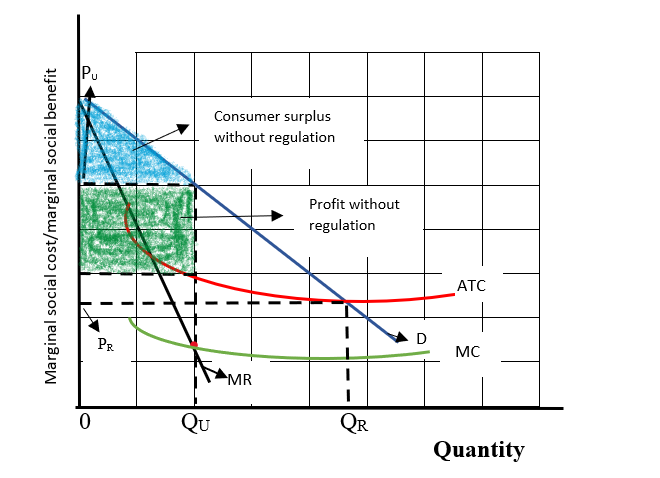
Price is represented in the vertical axis of the graph and quantity is shown on the horizontal axis of the graph. Here, the average total cost curve is in a downward slope whereas the marginal cost curve is also in a downward slope but it is below the ATC curve.
The unregulated QU is represented at the point of QU on the horizontal axis where MC and MR are equal and the unregulated PU is found above QU at the vertical axis on a demand curve which is in a downward slope.
Consumer surplus without regulation is shown as a triangular shaded area of grey color which is below the demand curve but above the price. The profit of the firm without regulation is found as a correct rectangular shaded area in blue color.
The regulated price which can maintain in the long run is shown on the vertical axis by denoting PR and the regulated quantity is shown on the horizontal axis by denoting QR.
Introduction: A natural monopoly is a market structure that occurred when the start-up cost is high or there is a high administrative cost and the need for powerful economies of scale to conduct the business.
d)
The effect on the size of consumer surplus and firm’s profit when the firm charge PR rather than PU
d)
Explanation of Solution
The graph has shown the data as follows:
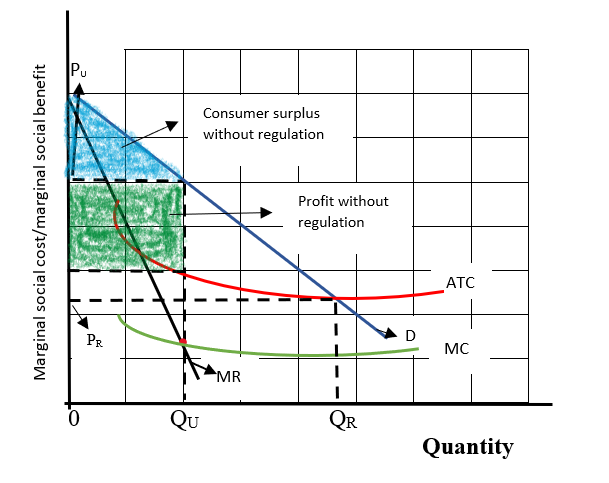
Here, the size of the consumer surplus will increase which will reach the point QR but the profit of the firm will reduce to zero when the PR price is charged by the firm rather than the price of PU where the profit and consumer surplus was high.
Introduction: A natural monopoly is a market structure that occurred when the start-up cost is high or there is a high administrative cost and the need for powerful economies of scale to conduct the business.
Chapter 77 Solutions
Krugman's Economics For The Ap® Course


 Principles of Economics (12th Edition)EconomicsISBN:9780134078779Author:Karl E. Case, Ray C. Fair, Sharon E. OsterPublisher:PEARSON
 Engineering Economy (17th Edition)EconomicsISBN:9780134870069Author:William G. Sullivan, Elin M. Wicks, C. Patrick KoellingPublisher:PEARSON
 Principles of Economics (MindTap Course List)EconomicsISBN:9781305585126Author:N. Gregory MankiwPublisher:Cengage Learning
 Managerial Economics: A Problem Solving ApproachEconomicsISBN:9781337106665Author:Luke M. Froeb, Brian T. McCann, Michael R. Ward, Mike ShorPublisher:Cengage Learning
 Managerial Economics & Business Strategy (Mcgraw-...EconomicsISBN:9781259290619Author:Michael Baye, Jeff PrincePublisher:McGraw-Hill Education