
Videos
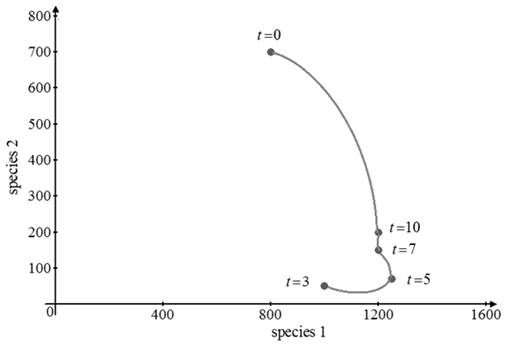
To sketch: The corresponding phase trajectory.
Answer to Problem 8E
The value gets decreases based on increase in time values.
Explanation of Solution
Given information:
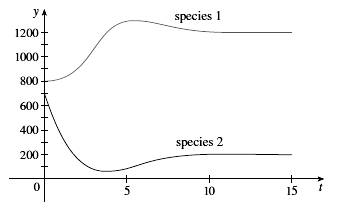
Graphs of populations of two species are shown. Use them to sketch the corresponding phase trajectory.
Formula used:
The graph is plotted against x axis and y axis.
Calculation:
The phase trajectory is sketched by using the above graphs as,
The populations of two species 1 and 2 at t= 0,15,10,15 are given below.
Along species 1:
y =800, when t =0
y=1000, when t =3
y=1250, when t =5
y=1200, when t =7
y=1200, when t =10
Along species 2:
y=700, when t =0
y=50, when t =3
y=70, when t =5
y=150, when t =7
y=200, when t =10
The sketch of the phase trajectory by taking species 1 as horizontal axis, and species 2 asvertical axis, and by using the above points, is shown below,
Conclusion:
The value get decreases based on increase in time values.
Chapter 7 Solutions
Single Variable Calculus: Concepts and Contexts, Enhanced Edition


 Calculus: Early TranscendentalsCalculusISBN:9781285741550Author:James StewartPublisher:Cengage Learning
 Thomas' Calculus (14th Edition)CalculusISBN:9780134438986Author:Joel R. Hass, Christopher E. Heil, Maurice D. WeirPublisher:PEARSON
 Calculus: Early Transcendentals (3rd Edition)CalculusISBN:9780134763644Author:William L. Briggs, Lyle Cochran, Bernard Gillett, Eric SchulzPublisher:PEARSON
 Calculus: Early TranscendentalsCalculusISBN:9781319050740Author:Jon Rogawski, Colin Adams, Robert FranzosaPublisher:W. H. Freeman
 Calculus: Early Transcendental FunctionsCalculusISBN:9781337552516Author:Ron Larson, Bruce H. EdwardsPublisher:Cengage Learning