MyLab Statistics with Pearson eText -- Standalone Access Card -- for Elementary Statistics: Picturing the World with Integrated Review
7th Edition
ISBN: 9780134761992
Author: Ron Larson
Publisher: PEARSON
expand_more
expand_more
format_list_bulleted
Videos
Textbook Question
Chapter 7.1, Problem 1TY
Write each claim as a mathematical statement. State the null and alternative hypotheses, and identify which represents the claim.
- 1. A consumer analyst reports that the
mean life of a certain type of automobile battery is not 74 months. - 2. An electronics manufacturer publishes that the variance of the life of its home theater systems is less than or equal to 2.7.
- 3. A realtor publicizes that the proportion of homeowners who feel their house is too small for their family is more than 24%.
Expert Solution & Answer

Learn your wayIncludes step-by-step video

schedule02:38
Students have asked these similar questions
ce-
216
Answer the following, using the figures and
tables from the age versus bone loss data in
2010 Questions 2 and 12:
a. For what ages is it reasonable to use the
regression line to predict bone loss?
b. Interpret the slope in the context of this
wolf X
problem.
y
min ball bas
oft
c. Using the data from the study, can you
say that age causes bone loss?
srls to sqota bri
vo X 1931s
aqsini-Y ST.0 0 Isups
Iq nsalst ever tom vam noboslios tsb
a ti segood insvla villemari
aixs-Yedi
120
110
110
100
90
80
Total Score
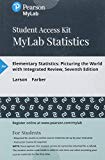
Scatterplot of Total Score vs. Putts
grit
bas
70-
20
25
30
35
40
45
50
Putts
10
15
Answer the following, using the figures and
tables from the temperature versus coffee
sales data from Questions 1 and 11:
a. How many coffees should the manager
prepare to make if the temperature is 32°F?
b. As the temperature drops, how much
more coffee will consumers purchase?ov
(Hint: Use the slope.)
21
bru sug
c. For what temperature values does the
voy marw regression line make the best predictions?
al X
al 1090391-Yrit,vewolf 30-X Inlog arts bauoxs
268 PART 4 Statistical Studies and the Hunt for
Chapter 7 Solutions
MyLab Statistics with Pearson eText -- Standalone Access Card -- for Elementary Statistics: Picturing the World with Integrated Review
Ch. 7.1 - Write each claim as a mathematical statement....Ch. 7.1 - A company specializing in parachute assembly...Ch. 7.1 - For each claim, state H0 and Ha in words and in...Ch. 7.1 - You perform a hypothesis test for each claim. How...Ch. 7.1 - 1. You represent a chemical company that is being...Ch. 7.1 - What are the two types of hypotheses used in a...Ch. 7.1 - Describe the two types of errors possible in a...Ch. 7.1 - Prob. 3ECh. 7.1 - Does failing to reject the null hypothesis mean...Ch. 7.1 - True or False? In Exercises 510, determine whether...
Ch. 7.1 - True or False? In Exercises 510, determine whether...Ch. 7.1 - True or False? In Exercises 510, determine whether...Ch. 7.1 - True or False? In Exercises 510, determine whether...Ch. 7.1 - True or False? In Exercises 510, determine whether...Ch. 7.1 - True or False? In Exercises 510, determine whether...Ch. 7.1 - Stating Hypotheses In Exercises 1116, the...Ch. 7.1 - Stating Hypotheses In Exercises 1116, the...Ch. 7.1 - Stating Hypotheses In Exercises 1116, the...Ch. 7.1 - Stating Hypotheses In Exercises 1116, the...Ch. 7.1 - Stating Hypotheses In Exercises 1116, the...Ch. 7.1 - Stating Hypotheses In Exercises 1116, the...Ch. 7.1 - Graphical Analysis In Exercises 1720, match the...Ch. 7.1 - Graphical Analysis In Exercises 1720, match the...Ch. 7.1 - Graphical Analysis In Exercises 1720, match the...Ch. 7.1 - Graphical Analysis In Exercises 1720, match the...Ch. 7.1 - Identifying a Test In Exercises 2124, determine...Ch. 7.1 - Identifying a Test In Exercises 2124, determine...Ch. 7.1 - Identifying a Test In Exercises 2124, determine...Ch. 7.1 - Identifying a Test In Exercises 2124, determine...Ch. 7.1 - Stating the Null and Alternative Hypotheses In...Ch. 7.1 - Stating the Null and Alternative Hypotheses In...Ch. 7.1 - Stating the Null and Alternative Hypotheses In...Ch. 7.1 - Stating the Null and Alternative Hypotheses In...Ch. 7.1 - Stating the Null and Alternative Hypotheses In...Ch. 7.1 - Stating the Null and Alternative Hypotheses In...Ch. 7.1 - Identifying Type I and Type II Errors In Exercises...Ch. 7.1 - Identifying Type I and Type II Errors In Exercises...Ch. 7.1 - Identifying Type I and Type II Errors In Exercises...Ch. 7.1 - Identifying Type I and Type II Errors In Exercises...Ch. 7.1 - Identifying Type I and Type II Errors In Exercises...Ch. 7.1 - Identifying Type I and Type II Errors In Exercises...Ch. 7.1 - Identifying the Nature of a Hypothesis Test In...Ch. 7.1 - Identifying the Nature of a Hypothesis Test In...Ch. 7.1 - Identifying the Nature of a Hypothesis Test In...Ch. 7.1 - Identifying the Nature of a Hypothesis Test In...Ch. 7.1 - Identifying the Nature of a Hypothesis Test In...Ch. 7.1 - Identifying the Nature of a Hypothesis Test In...Ch. 7.1 - Interpreting a Decision In Exercises 4348,...Ch. 7.1 - Interpreting a Decision In Exercises 4348,...Ch. 7.1 - Interpreting a Decision In Exercises 4348,...Ch. 7.1 - Interpreting a Decision In Exercises 4348,...Ch. 7.1 - Interpreting a Decision In Exercises 4348,...Ch. 7.1 - Interpreting a Decision In Exercises 4348,...Ch. 7.1 - Writing Hypotheses: Medicine A medical research...Ch. 7.1 - Writing Hypotheses: Transportation Network Company...Ch. 7.1 - Writing Hypotheses: Backpack Manufacturer A...Ch. 7.1 - Writing Hypotheses: Internet Provider An Internet...Ch. 7.1 - Prob. 53ECh. 7.1 - Getting at the Concept Explain why a level of...Ch. 7.1 - Prob. 55ECh. 7.1 - Prob. 56ECh. 7.1 - Graphical Analysis In Exercises 5760, you are...Ch. 7.1 - Graphical Analysis In Exercises 5760, you are...Ch. 7.1 - Graphical Analysis In Exercises 5760, you are...Ch. 7.1 - Graphical Analysis In Exercises 5760, you are...Ch. 7.2 - The P-value for a hypothesis test is P = 0.0745....Ch. 7.2 - Find the P-value for a left-tailed hypothesis test...Ch. 7.2 - Find the P-value for a two-tailed hypothesis test...Ch. 7.2 - Homeowners claim that the mean speed of...Ch. 7.2 - According to a study of employed U.S. adults ages...Ch. 7.2 - Repeat Example 6 using a level of significance of ...Ch. 7.2 - Find the critical value and rejection region for a...Ch. 7.2 - Find the critical values and rejection regions for...Ch. 7.2 - The CEO of the company in Example 9 claims that...Ch. 7.2 - In Example 10, at = 0.01, is there enough...Ch. 7.2 - Explain the difference between the z-test for ...Ch. 7.2 - In hypothesis testing, does using the critical...Ch. 7.2 - Interpreting a P-Value In Exercises 38, the...Ch. 7.2 - Interpreting a P-Value In Exercises 38, the...Ch. 7.2 - Interpreting a P-Value In Exercises 38, the...Ch. 7.2 - Interpreting a P-Value In Exercises 38, the...Ch. 7.2 - Interpreting a P-Value In Exercises 38, the...Ch. 7.2 - Interpreting a P-Value In Exercises 38, the...Ch. 7.2 - Finding a P-Value In Exercises 914, find the...Ch. 7.2 - Finding a P-Value In Exercises 914, find the...Ch. 7.2 - Finding a P-Value In Exercises 914, find the...Ch. 7.2 - Finding a P-Value In Exercises 914, find the...Ch. 7.2 - Finding a P-Value In Exercises 914, find the...Ch. 7.2 - Finding a P-Value In Exercises 914, find the...Ch. 7.2 - Graphical Analysis In Exercises 15 and 16, match...Ch. 7.2 - Graphical Analysis In Exercises 15 and 16, match...Ch. 7.2 - In Exercises 17 and 18, use the TI-84 Plus...Ch. 7.2 - In Exercises 17 and 18, use the TI-84 Plus...Ch. 7.2 - Finding Critical Values and Rejection Regions In...Ch. 7.2 - Finding Critical Values and Rejection Regions In...Ch. 7.2 - Finding Critical Values and Rejection Regions In...Ch. 7.2 - Finding Critical Values and Rejection Regions In...Ch. 7.2 - Finding Critical Values and Rejection Regions In...Ch. 7.2 - Finding Critical Values and Rejection Regions In...Ch. 7.2 - Graphical Analysis In Exercises 25 and 26, state...Ch. 7.2 - Graphical Analysis In Exercises 25 and 26, state...Ch. 7.2 - In Exercises 2730, test the claim about the...Ch. 7.2 - In Exercises 2730, test the claim about the...Ch. 7.2 - In Exercises 2730, test the claim about the...Ch. 7.2 - In Exercises 2730, test the claim about the...Ch. 7.2 - Hypothesis Testing Using a P-Value In Exercises...Ch. 7.2 - Hypothesis Testing Using a P-Value In Exercises...Ch. 7.2 - Hypothesis Testing Using a P-Value In Exercises...Ch. 7.2 - Hypothesis Testing Using a P-Value In Exercises...Ch. 7.2 - Hypothesis Testing Using a P-Value In Exercises...Ch. 7.2 - Hypothesis Testing Using a P-Value In Exercises...Ch. 7.2 - Hypothesis Testing Using Rejection Region(s) In...Ch. 7.2 - Hypothesis Testing Using Rejection Region(s) In...Ch. 7.2 - Hypothesis Testing Using Rejection Region(s) In...Ch. 7.2 - Hypothesis Testing Using Rejection Region(s) In...Ch. 7.2 - Hypothesis Testing Using Rejection Region(s) In...Ch. 7.2 - Hypothesis Testing Using Rejection Region(s) In...Ch. 7.2 - Writing When P , does the standardized test...Ch. 7.2 - Writing In a right-tailed test where P , does the...Ch. 7.3 - Find the critical value for a left-tailed test...Ch. 7.3 - Find the critical value t0 for a right-tailed lest...Ch. 7.3 - Find the critical values t0 and t0 for a...Ch. 7.3 - An industry analyst says that the mean age of a...Ch. 7.3 - The company in Example 5 claims that the mean...Ch. 7.3 - Another department of motor vehicles office claims...Ch. 7.3 - Explain how to find critical values for a...Ch. 7.3 - Explain how to use a t-test to test a hypothesized...Ch. 7.3 - In Exercises 38, find the critical value(s) and...Ch. 7.3 - In Exercises 38, find the critical value(s) and...Ch. 7.3 - In Exercises 38, find the critical value(s) and...Ch. 7.3 - In Exercises 38, find the critical value(s) and...Ch. 7.3 - In Exercises 38, find the critical value(s) and...Ch. 7.3 - In Exercises 38, find the critical value(s) and...Ch. 7.3 - Graphical Analysis In Exercises 912, state whether...Ch. 7.3 - Graphical Analysis In Exercises 912, state whether...Ch. 7.3 - Graphical Analysis In Exercises 912, state whether...Ch. 7.3 - Graphical Analysis In Exercises 912, state whether...Ch. 7.3 - In Exercises 1318, test the claim about the...Ch. 7.3 - In Exercises 1318, test the claim about the...Ch. 7.3 - In Exercises 1318, test the claim about the...Ch. 7.3 - In Exercises 1318, test the claim about the...Ch. 7.3 - In Exercises 1318, test the claim about the...Ch. 7.3 - In Exercises 1318, test the claim about the...Ch. 7.3 - Hypothesis Testing Using Rejection Regions In...Ch. 7.3 - Hypothesis Testing Using Rejection Regions In...Ch. 7.3 - Hypothesis Testing Using Rejection Regions In...Ch. 7.3 - Hypothesis Testing Using Rejection Regions In...Ch. 7.3 - Hypothesis Testing Using Rejection Regions In...Ch. 7.3 - Hypothesis Testing Using Rejection Regions In...Ch. 7.3 - Hypothesis Testing Using Rejection Regions In...Ch. 7.3 - Hypothesis Testing Using Rejection Regions In...Ch. 7.3 - Using a P-Value with a t-Test In Exercises 2730,...Ch. 7.3 - Using a P-Value with a t-Test In Exercises 2730,...Ch. 7.3 - Using a P-Value with a t-Test In Exercises 2730,...Ch. 7.3 - Using a P-Value with a t-Test In Exercises 2730,...Ch. 7.3 - Deciding on a Distribution In Exercises 31 and 32,...Ch. 7.3 - Prob. 32ECh. 7.3 - Writing You are testing a claim and incorrectly...Ch. 7.3 - Set n = 15, Mean = 40, Std. Dev. = 5, and the...Ch. 7.3 - Prob. 2ACh. 7.3 - Set n = 25, Mean = 25, Std. Dev. = 3, and the...Ch. 7.3 - Human Body Temperature: Whats Normal? In an...Ch. 7.3 - Human Body Temperature: Whats Normal? In an...Ch. 7.3 - Human Body Temperature: Whats Normal? In an...Ch. 7.3 - Human Body Temperature: Whats Normal? In an...Ch. 7.3 - Human Body Temperature: Whats Normal? In an...Ch. 7.3 - In an article in the Journal of Statistics...Ch. 7.4 - A researcher claims that more than 90% of U.S....Ch. 7.4 - A researcher claims that 67% of U.S. adults...Ch. 7.4 - Explain how to determine whether a normal...Ch. 7.4 - Explain how to test a population proportion p.Ch. 7.4 - In Exercises 36, determine whether a normal...Ch. 7.4 - In Exercises 36, determine whether a normal...Ch. 7.4 - In Exercises 36, determine whether a normal...Ch. 7.4 - In Exercises 36, determine whether a normal...Ch. 7.4 - Hypothesis Testing Using Rejection Regions In...Ch. 7.4 - Hypothesis Testing Using Rejection Regions In...Ch. 7.4 - Hypothesis Testing Using Rejection Regions In...Ch. 7.4 - Working Students An education researcher claims...Ch. 7.4 - Hypothesis Testing Using Rejection Regions In...Ch. 7.4 - Hypothesis Testing Using Rejection Regions In...Ch. 7.4 - Hypothesis Testing Using a P-Value In Exercises...Ch. 7.4 - Hypothesis Testing Using a P-Value In Exercises...Ch. 7.4 - Hypothesis Testing Using a P-Value In Exercises...Ch. 7.4 - Hypothesis Testing Using a P-Value In Exercises...Ch. 7.4 - Protecting the Environment In Exercises 17 and 18,...Ch. 7.4 - What Are Peoples Attitudes About Protecting the...Ch. 7.4 - Alternative Formula In Exercises 19 and 20, use...Ch. 7.4 - The alternative formula is derived from the...Ch. 7.4 - Set n = 25 and True p = 0.35. Test the claim that...Ch. 7.4 - Prob. 2ACh. 7.5 - Find the critical value02 right-tailed test when n...Ch. 7.5 - Prob. 2TYCh. 7.5 - Prob. 3TYCh. 7.5 - A bottling company claims that the variance of the...Ch. 7.5 - Prob. 5TYCh. 7.5 - A company that offers dieting products and weight...Ch. 7.5 - Explain how to find critical values in a...Ch. 7.5 - Can a critical value for the chi-square test be...Ch. 7.5 - Prob. 3ECh. 7.5 - Prob. 4ECh. 7.5 - In Exercises 512, find the critical value(s) and...Ch. 7.5 - In Exercises 512, find the critical value(s) and...Ch. 7.5 - In Exercises 512, find the critical value(s) and...Ch. 7.5 - In Exercises 512, find the critical value(s) and...Ch. 7.5 - In Exercises 512, find the critical value(s) and...Ch. 7.5 - In Exercises 512, find the critical value(s) and...Ch. 7.5 - In Exercises 512, find the critical value(s) and...Ch. 7.5 - In Exercises 512, find the critical value(s) and...Ch. 7.5 - Graphical Analysis In Exercises 13 and 14, state...Ch. 7.5 - Prob. 14ECh. 7.5 - In Exercises 1522, test the claim about the...Ch. 7.5 - Prob. 16ECh. 7.5 - In Exercises 1522, test the claim about the...Ch. 7.5 - In Exercises 1522, test the claim about the...Ch. 7.5 - In Exercises 1522, test the claim about the...Ch. 7.5 - Prob. 20ECh. 7.5 - In Exercises 1522, test the claim about the...Ch. 7.5 - In Exercises 1522, test the claim about the...Ch. 7.5 - Hypothesis Testing Using Rejection Regions In...Ch. 7.5 - Hypothesis Testing Using Rejection Regions In...Ch. 7.5 - Hypothesis Testing Using Rejection Regions In...Ch. 7.5 - Hypothesis Testing Using Rejection Regions In...Ch. 7.5 - Hypothesis Testing Using Rejection Regions In...Ch. 7.5 - Hypothesis Testing Using Rejection Regions In...Ch. 7.5 - Hypothesis Testing Using Rejection Regions In...Ch. 7.5 - Hypothesis Testing Using Rejection Regions In...Ch. 7.5 - Prob. 31ECh. 7.5 - Prob. 32ECh. 7.5 - Prob. 33ECh. 7.5 - Prob. 34ECh. 7 - EXERCISES In Exercises 13, assume that you work...Ch. 7 - Describe how your report could make a type I...Ch. 7 - Prob. 3UACh. 7 - In Exercises 16, the statement represents a claim....Ch. 7 - In Exercises 16, the statement represents a claim....Ch. 7 - Prob. 7.1.3RECh. 7 - In Exercises 16, the statement represents a claim....Ch. 7 - Prob. 7.1.5RECh. 7 - In Exercises 16, the statement represents a claim....Ch. 7 - In Exercises 710, (a) state the null and...Ch. 7 - Prob. 7.1.8RECh. 7 - Prob. 7.1.9RECh. 7 - In Exercises 710, (a) state the null and...Ch. 7 - In Exercises 11 and 12, find the P-value for the...Ch. 7 - Prob. 7.2.12RECh. 7 - Prob. 7.2.13RECh. 7 - In Exercises 1316, find the critical value(s) and...Ch. 7 - Prob. 7.2.15RECh. 7 - Prob. 7.2.16RECh. 7 - Prob. 7.2.17RECh. 7 - In Exercises 1720, state whether the standardized...Ch. 7 - In Exercises 1720, state whether the standardized...Ch. 7 - In Exercises 1720, state whether the standardized...Ch. 7 - In Exercises 2124, test the claim about the...Ch. 7 - In Exercises 2124, test the claim about the...Ch. 7 - In Exercises 2124, test the claim about the...Ch. 7 - Prob. 7.2.24RECh. 7 - In Exercises 25 and 26, (a) identify the claim and...Ch. 7 - In Exercises 25 and 26, (a) identify the claim and...Ch. 7 - In Exercises 27 and 28, (a) identify the claim and...Ch. 7 - In Exercises 27 and 28, (a) identify the claim and...Ch. 7 - Prob. 7.3.29RECh. 7 - In Exercises 2934, find the critical value(s) and...Ch. 7 - In Exercises 2934, find the critical value(s) and...Ch. 7 - Prob. 7.3.32RECh. 7 - Prob. 7.3.33RECh. 7 - In Exercises 2934, find the critical value(s) and...Ch. 7 - Prob. 7.3.35RECh. 7 - Prob. 7.3.36RECh. 7 - In Exercises 3540, test the claim about the...Ch. 7 - In Exercises 3540, test the claim about the...Ch. 7 - Prob. 7.3.39RECh. 7 - Prob. 7.3.40RECh. 7 - In Exercises 41 and 42, (a) identify the claim and...Ch. 7 - In Exercises 41 and 42, (a) identify the claim and...Ch. 7 - In Exercises 43 and 44, (a) identify the claim and...Ch. 7 - Prob. 7.3.44RECh. 7 - Prob. 7.4.45RECh. 7 - In Exercises 4548, determine whether a normal...Ch. 7 - Prob. 7.4.47RECh. 7 - In Exercises 4548, determine whether a normal...Ch. 7 - Prob. 7.4.49RECh. 7 - In Exercises 49 and 50, (a) identify the claim and...Ch. 7 - Prob. 7.5.51RECh. 7 - Prob. 7.5.52RECh. 7 - Prob. 7.5.53RECh. 7 - Prob. 7.5.54RECh. 7 - Prob. 7.5.55RECh. 7 - Prob. 7.5.56RECh. 7 - Prob. 7.5.57RECh. 7 - In Exercises 5558, test the claim about the...Ch. 7 - Prob. 7.5.59RECh. 7 - Prob. 7.5.60RECh. 7 - Prob. 7.5.61RECh. 7 - Prob. 7.5.62RECh. 7 - Take this quiz as you would take a quiz in class....Ch. 7 - Prob. 2CQCh. 7 - Take this quiz as you would take a quiz in class....Ch. 7 - Prob. 4CQCh. 7 - Prob. 5CQCh. 7 - Prob. 6CQCh. 7 - Take this test as you would take a test in class....Ch. 7 - Take this test as you would take a test in class....Ch. 7 - Take this test as you would take a test in class....Ch. 7 - Take this test as you would take a test in class....Ch. 7 - Take this quiz as you would take a quiz in class....Ch. 7 - Take this test as you would take a test in class....Ch. 7 - Take this quiz as you would take a quiz in class....Ch. 7 - Supporting a Claim You want your test to support a...Ch. 7 - Testing a Claim You want to claim that students at...Ch. 7 - Testing a Claim You want to claim that your...Ch. 7 - EXERCISES 1. The Minilab display below shows a...Ch. 7 - In Exercise 1, you rejected the claim that p =...Ch. 7 - Describe a hypothesis test for Judge Fords random...
Additional Math Textbook Solutions
Find more solutions based on key concepts
The quotient in the given expression
Pre-Algebra Student Edition
Suppose that A and B are mutually exclusive events for which P(A) = .3 and P(B) = .5. What is the probability t...
A First Course in Probability (10th Edition)
Fill in each blank so that the resulting statement is true. The quadratic function f(x)=a(xh)2+k,a0, is in ____...
Algebra and Trigonometry (6th Edition)
Find the point-slope form of the line passing through the given points. Use the first point as (x1, .y1). Plot ...
College Algebra with Modeling & Visualization (5th Edition)
Critical Thinking. In Exercises 17–28, use the data and confidence level to construct a confidence interval est...
Elementary Statistics (13th Edition)
Knowledge Booster


Learn more about
Need a deep-dive on the concept behind this application? Look no further. Learn more about this topic, statistics and related others by exploring similar questions and additional content below.Similar questions
- 18 Using the results from the rainfall versus corn production data in Question 14, answer DOV 15 the following: a. Find and interpret the slope in the con- text of this problem. 79 b. Find the Y-intercept in the context of this problem. alb to sig c. Can the Y-intercept be interpreted here? (.ob or grinisiques xs as 101 gniwollol edt 958 orb sz) asiques sich ed: flow wo PEMAIarrow_forwardVariable Total score (Y) Putts hit (X) Mean. 93.900 35.780 Standard Deviation 7.717 4.554 Correlation 0.896arrow_forward17 Referring to the figures and tables from the golf data in Questions 3 and 13, what hap- pens as you keep increasing X? Does Y increase forever? Explain. comis word ே om zol 6 svari woy wol visy alto su and vibed si s'ablow it bas akiog vino b tad) beil Bopara Aon csu How wod griz -do 30 義arrow_forward
- Variable Temperature (X) Coffees sold (Y) Mean 35.08 29,913 Standard Deviation 16.29 12,174 Correlation -0.741arrow_forward13 A golf analyst measures the total score and number of putts hit for 100 rounds of golf an amateur plays; you can see the summary of statistics in the following table. (See the figure in Question 3 for a scatterplot of this data.)noitoloqpics bella a. Is it reasonable to use a line to fit this data? Explain. 101 250 b. Find the equation of the best fitting 15er regression line. ad aufstuess som 'moob Y lo esulav in X ni ognado a tad Variable on Mean Standard Correlation 92 Deviation Total score (Y) 93.900 7.717 0.896 Putts hit (X) 35.780 4.554 totenololbenq axlam riso voy X to asulisy datdw gribol anil er 08,080.0 zl noitsism.A How atharrow_forwardVariable Bone loss (Y) Age (X) Mean 35.008. 67.992 Standard Deviation 7.684 10.673 Correlation 0.574arrow_forward
- 50 Bone Loss 30 40 20 Scatterplot of Bone Loss vs. Age . [902) 10 50 60 70 80 90 Age a sub adi u xinq (20) E 4 adw I- nyd med ivia .0 What does a scatterplot that shows no linear relationship between X and Y look like?arrow_forwardVariable Temperature (X) Coffees sold (Y) Mean 35.08 29,913 Standard Deviation 16.29 12,174 Correlation -0.741arrow_forward2 Find and interpret the value of r² for the rainfall versus corn data, using the table from Question 14.2291992 b sgen gnome vixists 992 ms up? 2910 1999 bio .blos estos $22 tolqis2 qs rieds ni zoti swoH iisqa vilsen od 1'meo DOV to mogers boangas mus jil Reustar enou Leption20th ) abnuin Hagodt graub 032 Carrow_forward
- 18 Using the results from the rainfall versus corn production data in Question 14, answer oy the following: DOY 98 103 LA Find and interpret the slope in the con- text of this problem. b. Find the Y-intercept in the context of this problem. roy gatiigisve Toy c. Can the Y-intercept be interpreted here? (.ob o grinisq blo eiqmaxs as 101 galwollol edt 998 ds most notamotni er griau sib 952) siqmaxs steb godt llaw worl pun MAarrow_forwardVariable mean standard variation correlation temperature(X) 35.08 16.29. -0,741 coffees sold(Y). 29,913. 12.174.arrow_forward12 ம் Y si to no 1672 1 A medical researcher measures bone density and the age of 125 women; you can see the o lesummary of statistics in the following table. (See the figure in Question 2 for a scatterplot of this data.) a. How well will a line fit this data? b. Find the equation of the best fitting regression line. Variable Mean Standard Correlation Deviation Bone loss (Y) 35.008 7.684 0.574 A Age (X) 19 67.992 10.673 T in send art lo (d) sqala sala bolt 3 esmit sqola ad garrow_forward
arrow_back_ios
SEE MORE QUESTIONS
arrow_forward_ios
Recommended textbooks for you
 Glencoe Algebra 1, Student Edition, 9780079039897...AlgebraISBN:9780079039897Author:CarterPublisher:McGraw Hill
 Big Ideas Math A Bridge To Success Algebra 1: Stu...AlgebraISBN:9781680331141Author:HOUGHTON MIFFLIN HARCOURTPublisher:Houghton Mifflin Harcourt
 Holt Mcdougal Larson Pre-algebra: Student Edition...AlgebraISBN:9780547587776Author:HOLT MCDOUGALPublisher:HOLT MCDOUGAL
Glencoe Algebra 1, Student Edition, 9780079039897...
Algebra
ISBN:9780079039897
Author:Carter
Publisher:McGraw Hill
Big Ideas Math A Bridge To Success Algebra 1: Stu...
Algebra
ISBN:9781680331141
Author:HOUGHTON MIFFLIN HARCOURT
Publisher:Houghton Mifflin Harcourt
Holt Mcdougal Larson Pre-algebra: Student Edition...
Algebra
ISBN:9780547587776
Author:HOLT MCDOUGAL
Publisher:HOLT MCDOUGAL
Hypothesis Testing using Confidence Interval Approach; Author: BUM2413 Applied Statistics UMP;https://www.youtube.com/watch?v=Hq1l3e9pLyY;License: Standard YouTube License, CC-BY
Hypothesis Testing - Difference of Two Means - Student's -Distribution & Normal Distribution; Author: The Organic Chemistry Tutor;https://www.youtube.com/watch?v=UcZwyzwWU7o;License: Standard Youtube License