
Videos
(a)
To find: the evidence that the average height of all 16 year old females at this school is greater than 64 inches, on average.
(a)
Answer to Problem 14E
Sample
Explanation of Solution
Given:
The evidence that the average height of all 16-year-old females at this school is greater than 64 inches on average is then the sample mean of 64.7 inches, which is greater than 64 inches.
(b)
To Explain: the two explanations for the evidence described in part (a).
(b)
Explanation of Solution
Given:
The evidence that the average height of all 16-year-old females at this school is greater than 64 inches on average is then the sample mean of 64.7 inches, which is greater than 64 inches.
It is possible that the sample mean is greater than 64 inches, the reason behind is that the population mean height is actually 64 inches and it is obtained a sample with sample mean of 64.7 inches by chance.
Although, it is also possible that the sample mean is greater than 64 inches, the reason behind is that the population mean height is actually higher than 64 inches.
(c)
To Explain: this value represents.
(c)
Explanation of Solution
Given:
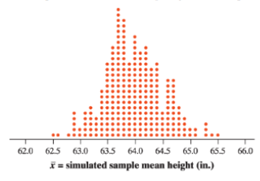
By seeing the dot plot, it is observed that dot in the given dot plot represents a sample
The dot at 62.5 then represents one simple random sample of 20 16-years-old females in which the sample mean height is 62.5 inches.
(d)
To Explain: that would it be surprising to get a sample mean or larger in an SRS of size 20 when mean 64 inched and standard deviation is 2.5 inches.
(d)
Explanation of Solution
By seeing the do plot, it is observed that every dot in the given dot plot represents a sample
There are 11 dots above 64.7 inches and there are also many dots to the right of 64.7 inches in the given dot plot. This then indicates that it is very likely to obtain a sample mean of at least 64.7 inches, when the population mean is actually 64 inches. Therefore it is not surprising to get a sample mean of 64.7 or larger.
(e)
To Explain: that there is convincing evidence that the average height of all 16 year old females at this school is greater than 64 inches.
(e)
Explanation of Solution
By seeing the dot plot it is observed that each dot in the given dot plot represents a sample
There are 11 dots above 64.7 inches and there are also many dots to the right of 64.7 inches in the given dot plot. This then indicates that it is very likely to obtain a sample mean of at least 64.7 inches, when the population mean is actually 64 inches. Therefore it is not surprising to get a sample mean of 64.7 or larger.
This then also implies that there is no convincing evidence that the average height of all 16-year-old females at this school is greater than 64 inches.
Chapter 7 Solutions
PRACTICE OF STATISTICS F/AP EXAM
Additional Math Textbook Solutions
Elementary Statistics Using Excel (6th Edition)
Elementary Statistics
Essentials of Statistics, Books a la Carte Edition (5th Edition)
Statistics: The Art and Science of Learning from Data (4th Edition)


 MATLAB: An Introduction with ApplicationsStatisticsISBN:9781119256830Author:Amos GilatPublisher:John Wiley & Sons Inc
 Probability and Statistics for Engineering and th...StatisticsISBN:9781305251809Author:Jay L. DevorePublisher:Cengage Learning
 Statistics for The Behavioral Sciences (MindTap C...StatisticsISBN:9781305504912Author:Frederick J Gravetter, Larry B. WallnauPublisher:Cengage Learning
 Elementary Statistics: Picturing the World (7th E...StatisticsISBN:9780134683416Author:Ron Larson, Betsy FarberPublisher:PEARSON
 The Basic Practice of StatisticsStatisticsISBN:9781319042578Author:David S. Moore, William I. Notz, Michael A. FlignerPublisher:W. H. Freeman
 Introduction to the Practice of StatisticsStatisticsISBN:9781319013387Author:David S. Moore, George P. McCabe, Bruce A. CraigPublisher:W. H. Freeman