
Concept explainers
a)
To determine: The standard time for the operation.
Introduction: The amount of the dependency on human effort by an organization in terms of achieving its goals is given by the work design. It is directly linked to the productivity of an organization where good work design helps in achieving high productivity.
a)
Answer to Problem 9P
Explanation of Solution
Given information:
| Performance rating | Observations (minutes per cycles) | Allowance | ||||
| 1 | 2 | 3 | 4 | 5 | ||
| 0.9 | 1.4 | 1.42 | 1.39 | 1.38 | 1.41 | 0.10 |
| 1.2 | 2.1 | 2.05 | 2 | 1.85 | 1.8 | 0.10 |
| 1.11 | 1.6 | 1.4 | 1.5 | 1.45 | 1.55 | 0.10 |
Formula:
| Element | Performance rating | Observations (minutes per cycles) | Allowance | Observed time | Normal time | Afjob | Standard time | ||||
| 1 | 2 | 3 | 4 | 5 | |||||||
| A | 0.9 | 1.4 | 1.42 | 1.39 | 1.38 | 1.4 | 0.10 | 1.4 | 1.26 | 1.10 | 1.39 |
| B | 1.2 | 2.1 | 2.05 | 2 | 1.85 | 1.8 | 0.10 | 1.96 | 2.352 | 1.10 | 2.59 |
| C | 1.11 | 1.6 | 1.4 | 1.5 | 1.45 | 1.6 | 0.10 | 1.5 | 1.665 | 1.10 | 1.83 |
| Standard time for operation | 5.80 | ||||||||||
Calculation of standard time of operation:
Excel Worksheet:
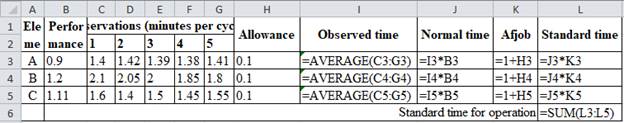
Element A:
Normal time is calculated by multiplying observed timing, 1.4 and performance rating, 0.9 which yields 1.26 minutes.
Allowance factor is calculated by adding 1 with the allowance factor 0.10 to give 1.10.
Standard time for element A is calculated by multiplying normal time of 1.26 minutes with allowance factor of 1.10 which gives 1.39 minutes.
Same process applies for element B and C which yields the standard times as 2.59 and 1.83. The standard time for operation is obtained by adding 1.39, 2.59 and 1.83 minutes which gives 5.80 minutes.
Hence, the standard time for the operation is 5.80 minutes.
b)
To determine: The number of observations for element A
Introduction: The amount of the dependency on human effort by an organization in terms of achieving its goals is given by the work design. It is directly linked to the productivity of an organization where good work design helps in achieving high productivity.
b)
Answer to Problem 9P
Explanation of Solution
Given information:
| Performance rating | Observations (minutes per cycles) | Allowance | ||||
| 1 | 2 | 3 | 4 | 5 | ||
| 0.9 | 1.4 | 1.42 | 1.39 | 1.38 | 1.41 | 0.10 |
| 1.2 | 2.1 | 2.05 | 2 | 1.85 | 1.8 | 0.10 |
| 1.11 | 1.6 | 1.4 | 1.5 | 1.45 | 1.55 | 0.10 |
Confidence= 98%
4% of true value
Formula:
Calculation of number of observations for element A:
In the above formula the sample standard deviation is calculated by,
Calculation of standard deviation:
| Element A | Differences | Square of differences | Standard deviation |
| 1.4 | 0 | 0 | 0.015811 |
| 1.42 | 0.02 | 0.0004 | |
| 1.39 | -0.01 | 0.0001 | |
| 1.38 | -0.02 | 0.0004 | |
| 1.41 | 0.01 | 0.0001 | |
| Mean=1.4 | SSQ=0.001 |
Excel worksheet:

Z value for confidence interval of 98% is 2.33.
The confidence interval
Using z = 2.33:
The number of observations from the standard z table for confidence level of 98% is calculated by dividing the product of 2.33 and 0.0158 with product of 0.04 and 1.40 and squaring the resultant which gives 0.4322. Rounding off the value it gives the number of observation as 1.
Hence, the number of observation is 1.
c)
To determine: The number of observations for element C.
Introduction: The amount of the dependency on human effort by an organization in terms of achieving its goals is given by the work design. It is directly linked to the productivity of an organization where good work design helps in achieving high productivity.
c)
Answer to Problem 9P
Explanation of Solution
Given information:
| Performance rating | Observations (minutes per cycles) | Allowance | ||||
| 1 | 2 | 3 | 4 | 5 | ||
| 0.9 | 1.4 | 1.42 | 1.39 | 1.38 | 1.41 | 0.10 |
| 1.2 | 2.1 | 2.05 | 2 | 1.85 | 1.8 | 0.10 |
| 1.11 | 1.6 | 1.4 | 1.5 | 1.45 | 1.55 | 0.10 |
Confidence= 90%
0.10 minute of actual value.
Formula:
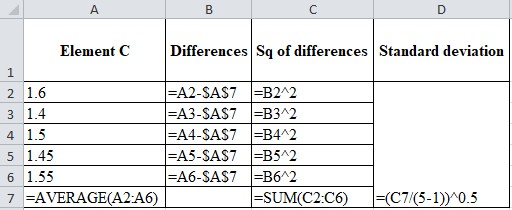
Calculation of number of observations for element C:
In the above formula the sample standard deviation is calculated by,
Calculation of standard deviation:
| Element C | Differences | Square of differences | Standard deviation |
| 1.6 | 0.1 | 0.01 | 0.0791 |
| 1.4 | -0.1 | 0.01 | |
| 1.5 | 0 | 0 | |
| 1.45 | -0.05 | 0.0025 | |
| 1.55 | 0.05 | 0.0025 | |
| Mean=1.5 | SSQ=0.025 |
Excel worksheet:
Z value for confidence interval of 90% is 1.65.
The confidence interval
- Using z = 1.64:
The number of observations from the standard z table for confidence level of 90 is calculated by dividing the product of 1.64 and 0.0791 with 0.10 and squaring the resultant which gives 1.6828.
- Using z = 1.65:
The number of observations from the standard z table for confidence level of 90 is calculated by dividing the product of 1.65 and 0.0791 with 0.10 and squaring the resultant which gives 1.7034.
Hence, the number of observations for element C is 2
Want to see more full solutions like this?
Chapter 7 Solutions
EBK OPERATIONS MANAGEMENT


- 5. The manager of Asombrado Bounty Office, Charles Badillo, estimates his employees are idle 25%of the time. With that problem, how many work samples are needed to consider within 3%accuracy and have 95.45% confidence level. 6. At ASP Micro Manufacturing, Inc. workers press semiconductor into predrilled slots on printed-circuit boards. Determine the normal time of the operation in seconds. The elemental motions for normal time used by the company are as follows:• Reach 6 inches for semiconductors 10.5 TMU• Grasp the semiconductors 8.0 TMU• Move semiconductor to printed-circuit board 9.5 TMU• Position semiconductor 20.1 TMU• Press semiconductor into slots 20.3 TMU• Move board aside 15.8 TMU 7. The semiconductor used in Costin Calculator has 5 components with the consistency of 90%, 95%,98%, 90%, and 99%, respectively. How reliable is one product of calculator?arrow_forwardEach year, Lord & Taylor, Ltd., sets up a giftwrapping station to assist its customers with holiday shopping. Preliminary observations of one worker at the stationproduced the following sample time (in minutes per package):3.5, 3.2, 4.1, 3.6, 3.9. Based on this small sample, what number of observations would be necessary to determine the truecycle time with a 95% confidence level and an accuracy of{5%?arrow_forward. Given the following information, determine the sample sizeneeded if the standard time estimate is to be within 5 percent ofthe true mean 97 percent of the time. Work Element Standard Deviation (minutes) Mean Observed Time (minutes)l 0.20 1.102 0.10 0.803 0.15 0.904 0.10 1.00arrow_forward
- K Claudine Soosay recorded the following times assembling a watch: Observation No. 1234567co 8 Time (minutes) 0.12 0.10 0.11 0.11 0.15 0.10 0.10 0.10 Observation No. 9 10 11 12 13 14 15 16 Time (minutes) 0.11 0.08 0.11 0.10 0.10 0.11 0.14 0.08arrow_forwardQ2 (a) A time study analyst timed an assembly operation for 30 cycles, and then computed the average time per cycle, which was 18.75 minutes. The analyst assigned a performance rating of 0.96 and decided that an appropriate allowance was 15 percent. Assume the allowance factor is based on the workday. Determine the following: (i) Observed time (OT) (ii) The Normal times (NT) (iii) The standard time (ST) (b) If the analyst wants to estimate the number of observations that will be needed to achieve a specified maximum error, with a confidence of 95.5 %. A preliminary study yielded a mean of 5.2 minutes and a standard deviation of 1.1 minutes. Determine the total number of observation needed for these two cases: (a) A maximum error of + or - 6 % (b) A maximum error of 40 minutesarrow_forwardThe results of a time study to perform a quality control test are shown in the following table: *Disregard employee is smoking a cigarette (included in personal time). The allowance factor is given to be 25%. a) The normal time for the complete operation = b) The standard time for this process = Performance Observation (minutes per cycle) Element Rating 1 2 3 4 5 1 95% 1.5 1.8 23 2 110% 0.8 0.5 90% 0.5 0.4 4 85% 0.6 0.9 8549 1.8 1.9 1.4 0.6 3.7* 0.6 0.6 0.4 0.4 0.7 0.7 0.7 minutes (round your response to two decimal places). minutes (round your response to two decimal places).arrow_forward
- erations Management Spring21 Time left 1:09:19 stion In a fabric manufacturing factory, the quality control process using control charts from SPC. In an hour there are a total of 5 samples are taken each having 5 observations regarding the thickness of fabric in measured in millimeters. In a particular hour, the sample means (X-bar) are noted to be: 156.46, 199.62, 189.31, 102.22, and112.09 respectively. In the same sample, the corresponding ranges are: 11.97, 12.17, 13.94, 11.86, and 11.83 respectively. What are the lower and upper control limits for the X-bar chart? et ered ed out of O a. None is correct lag O b. 156.55, 170.47 tion O C. 144.77, 159.11 O d. 145.40, 190.72 O e. 143.55, 165.47 Of. 142.92, 160.66 Fi PREVIOUS PAGE NEXT PAGE O Type here to search %23arrow_forward8. A teller at a drive-up window at a bank had the following service times (in minutes) for 20 randomly selected customers: SAMPLE 1 2 3 4 4.5 4.6 4.5 4.7 4.2 4.5 4.6 4.6 4.2 4.4 4.4 4.8 4.3 4.7 4.4 4.5 4.3 4.3 4.6 4.9 Select a chart to monitor the central tendency of the process, what are the 3-sigma control limits using a mean chart? Keep 3 decimal places. Select one: a. LCL = 4.212, UCL = 4.788 b. LCL = 4.414, UCL = 4.586 c. LCL = 4.245, UCL = 4.755 d. None of the other options. e. LCL = 4.385, UCL = 4.615arrow_forwardA business analyst wants to validate a standard time for an existing process of a work operation. A previous study conducted have the following information: Standard Deviation - 30 seconds; Average time – 300 seconds With the desired confidence level of 90% and maximum error of 5%, how many observations should the business analyst conduct? Note: Round-up your answer to whole number. Confidence Level Standard Deviation 80% 1.282 90% 1.645 95% 1.960 99% 2.576arrow_forward
- Supervisor Kenneth Peterson wants to determine the percent of time a machine in his area is idle. He decides to use work sampling, and his initial estimate is that the machine is idle 18% of the time. (Round all intermediate calculations to at least two decimal places before proceeding with further calculations.) Part 2 The number of observations that need to be taken by Peterson to be 98.00% confident that the results will be less than 6% from the true result = enter your response here (round your response to the immediate higher whole number).arrow_forwardII. Exercise You have been asked to develop a work sample for a receptionist position in a three-person law firm. The lawyers believe this might be the best way to evaluate applicants, especially because they are seeking someone with a disability and they do not believe in the practical credibility of standardized measures. 1. What information do you need to design the work sample? 2. What materials do you need? 3. What are the criteria for your observation schedule as the consumer performs the work sample?arrow_forwardThe Dubuque Cement Company packs 80-pound bagsof concrete mix. Time-study data for the filling activity are shown inthe following table. Because of the high physical demands of the job,the company's policy is a 23% allowance for workers.a) Compute the standard time for the bag-packing task.b) How many observations are necessary for 99% confidence,within ±5% accuracy?arrow_forward
 Practical Management ScienceOperations ManagementISBN:9781337406659Author:WINSTON, Wayne L.Publisher:Cengage,
 Operations ManagementOperations ManagementISBN:9781259667473Author:William J StevensonPublisher:McGraw-Hill Education
 Operations and Supply Chain Management (Mcgraw-hi...Operations ManagementISBN:9781259666100Author:F. Robert Jacobs, Richard B ChasePublisher:McGraw-Hill Education
 Purchasing and Supply Chain ManagementOperations ManagementISBN:9781285869681Author:Robert M. Monczka, Robert B. Handfield, Larry C. Giunipero, James L. PattersonPublisher:Cengage Learning
 Production and Operations Analysis, Seventh Editi...Operations ManagementISBN:9781478623069Author:Steven Nahmias, Tava Lennon OlsenPublisher:Waveland Press, Inc.