EBK MANAGERIAL ACCOUNTING
5th Edition
ISBN: 8220103613811
Author: TIETZ
Publisher: PEARSON
expand_more
expand_more
format_list_bulleted
Concept explainers
Videos
Textbook Question
Chapter 7, Problem 7.61AP
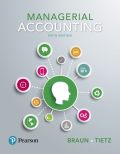
Find missing data in CVP relationships (Learning Objectives 1 & 2)
The budgets of four companies yield the following information:
Requirements
- 1. Fill in the blanks for each company.
- 2. Compute breakeven, in sales dollars, for each company. Which company has the lowest breakeven point in sales dollars? What causes the low breakeven point?
Expert Solution & Answer
Want to see the full answer?
Check out a sample textbook solution
Students have asked these similar questions
Jalancu Juviai u
The following are a number of measures associated with the Balanced Scorecard.
Required:
1. Classify each performance measure as belonging to one of the following perspectives: financial, customer, internal business process, or learning and growth.
a. Number of new customers
b. Percentage of customer complaints resolved with one contact
C. Unit product cost
d.
Cost per distribution channel
e. Suggestions per employee
f.
Warranty repair costs
Consumer satisfaction (from surveys)
Cycle time for solving a customer problem
Strategic job coverage ratio
j.
On-time delivery percentage
k. Percentage of revenues from new products
2. Select an additional measure that would be appropriate for each of the four perspectives.
Contribution margin by product ▾
Number of complaints
Number of accidents per month
Hours of continuing education provided per month
g.
h.
i.
Financial
Customer
Customer
Internal business process
Financial
Financial
Learning and growth
Learning and growth…
Reid Company would like to implement a balanced scorecard performance measurement system. Its senior management team has
assembled the measures shown below for possible inclusion in its scorecard.
Required:
For each measure, indicate by placing an X in the appropriate column whether it would most likely be classified in the learning and
growth, internal business process, customer, or financial category of the company's balanced scorecard.
Learning
&
Growth
Internal
Business
Process
Item
Customer
Financial
Ex. Employee absenteeism rate
X
1. Sales from new customers
2. Customer defection rate
3. Average fuel cost per sales dollar
4. Average number of workplace accidents per employee
5. Delivery cycle time
6. Average training hours per employee
7. Number of job applicants from under-represented groups
Percent of customers that strongly agree with the statement
8.
"Your employees treated me courteously."
9. Return on assets
Percent of customers that strongly agree with the statement
"Your…
Learning Objective 05-P2: Compute the break-even point for a single-product company.
Skip to question
A company’s break-even point for a period is the sales volume at which total revenues equal total costs. To compute a break-even point in terms of sales units, we divide total fixed costs by the contribution margin per unit. To compute a break-even point in terms of sales dollars, divide total fixed costs by the contribution margin ratio.
Cost-Volume-Profit Chart
Current Time 0:00
/
Duration 1:56
1x
Knowledge Check 01
Based on a CVP graph, select the correct drop-down answer for each question.
Chapter 7 Solutions
EBK MANAGERIAL ACCOUNTING
Ch. 7 - (Learning Objective 1) The contribution margin is...Ch. 7 - (Learning Objective 1) The contribution margin...Ch. 7 - (Learning Objective 2) The formula to find the...Ch. 7 - Prob. 4QCCh. 7 - Prob. 5QCCh. 7 - Prob. 6QCCh. 7 - (Learning Objective 4) Which of the following is...Ch. 7 - Prob. 8QCCh. 7 - Prob. 9QCCh. 7 - Prob. 10QC
Ch. 7 - Compute unit contribution margin and contribution...Ch. 7 - Prob. 7.2SECh. 7 - Prob. 7.3SECh. 7 - Find target profit volume (Learning Objective 2)...Ch. 7 - Prob. 7.5SECh. 7 - Prob. 7.6SECh. 7 - Prob. 7.7SECh. 7 - Prob. 7.8SECh. 7 - Compute margin of safety (Learning Objective 5)...Ch. 7 - Compute and use operating leverage factor...Ch. 7 - Calculate breakeven and target profit sales...Ch. 7 - Prob. 7.12SECh. 7 - Prob. 7.13SECh. 7 - Prob. 7.14SECh. 7 - Compute margin of safety (Learning Objective 5)...Ch. 7 - Compute and use operating leverage factor...Ch. 7 - Prob. 7.17SECh. 7 - Prob. 7.18SECh. 7 - Prepare contribution margin income statements...Ch. 7 - Work backward to find missing information...Ch. 7 - Find breakeven and target profit volume (Learning...Ch. 7 - Prob. 7.22AECh. 7 - Prob. 7.23AECh. 7 - Prob. 7.24AECh. 7 - Prob. 7.25AECh. 7 - Prob. 7.26AECh. 7 - Sustainability and CVP concepts (Learning...Ch. 7 - Prob. 7.28AECh. 7 - Calculate contribution margin and breakeven...Ch. 7 - Prob. 7.30AECh. 7 - Extension of E7-30A: Multiproduct firm (Learning...Ch. 7 - Prob. 7.32AECh. 7 - Breakeven and an advertising decision at a...Ch. 7 - Prob. 7.34AECh. 7 - Prob. 7.35AECh. 7 - Prob. 7.36AECh. 7 - Comprehensive CVP analysis (Learning Objectives 1,...Ch. 7 - Comprehensive CVP analysis (Learning Objectives 1,...Ch. 7 - Prob. 7.39AECh. 7 - Prob. 7.40BECh. 7 - Work backward to find missing information...Ch. 7 - Find breakeven and target profit volume (Learning...Ch. 7 - Prob. 7.43BECh. 7 - Prob. 7.44BECh. 7 - Prob. 7.45BECh. 7 - Prob. 7.46BECh. 7 - Continuation of E7-46B: Changing business...Ch. 7 - Sustainability and CVP (Learning Objective 3)...Ch. 7 - Prob. 7.49BECh. 7 - Prob. 7.50BECh. 7 - Prob. 7.51BECh. 7 - Prob. 7.52BECh. 7 - Find breakeven for a multiproduct firm (Learning...Ch. 7 - Breakeven and an advertising decision at a...Ch. 7 - Compute margin of safety and operating leverage...Ch. 7 - Use operating leverage factor to find fixed costs...Ch. 7 - Prob. 7.57BECh. 7 - Comprehensive CVP analysis (Learning Objectives 1,...Ch. 7 - Prob. 7.59BECh. 7 - Comprehensive CVP analysis (Learning Objectives 1,...Ch. 7 - Find missing data in CVP relationships (Learning...Ch. 7 - Prob. 7.62APCh. 7 - Prob. 7.63APCh. 7 - Prob. 7.64APCh. 7 - Prob. 7.65APCh. 7 - Prob. 7.66APCh. 7 - Find missing data in CVP relationships (Learning...Ch. 7 - Prob. 7.68BPCh. 7 - Comprehensive CVP problem (Learning Objectives 1,...Ch. 7 - Prob. 7.70BPCh. 7 - Prob. 7.71BPCh. 7 - CVP analysis at a multiproduct firm (Learning...Ch. 7 - Prob. 7.73SCCh. 7 - Discussion Questions 1. Define breakeven point....Ch. 7 - Prob. 7.75ACTCh. 7 - Prob. 7.76ACTCh. 7 - Prob. 7.77ACT
Knowledge Booster


Learn more about
Need a deep-dive on the concept behind this application? Look no further. Learn more about this topic, accounting and related others by exploring similar questions and additional content below.Similar questions
- Required information Learning Objective 05-P2: Compute the break-even point for a single-product company. A company's break-even point for a period is the sales volume at which total revenues equal total costs. To compute a break-even point in terms of sales units, we divide total fixed costs by the contribution margin per unit. To compute a break-even point in terms of sales dollars, divide total fixed costs by the contribution margin ratio. Cost-Volume-Profit Chart Dollars Maximum productive capacity = 1,800 units Sales = $180,000 $1800,000 $160,000 $140,000 $120,000 $100,000 Largest Income = $30,000 $80,000 Maximum productive capacity = 1,800 units Break-Even Point (sales of 800 units or $80,000) Total Sales Total Costsarrow_forwardLearning Tasks A. Discussion Questions: 1. Explain why a contribution margin per unit becomes profit per unit above the breakeven point. 2. Suppose a firm with a contribution margin percentage of 30% increased its advertising expenses by P10,000 and found that sales increased by P 30,000. Was it a good decision to increase advertising expenses? Suppose that the contribution margin ratio is now 40%. Would it be a good decision to increase advertising expense? B. Fill in the blanks for each of the following independent cases. Case Revenues Variable Cost Fixed Cost Total Costs Operating Contribution Income Margin Percentage A P500 P- P800 P1,200 2,000 1,000 В 300 200 C 700 1,000 ---- ---- 1,500 300 40% Assessment Taskarrow_forwardSpecifically, Mr. Schaefer wants you to do the following: PART 1. Prepare a cost-volume-profit (CVP) analysis of the proposal's financial implications. 1. Specifically, prepare an analysis that includes the projected revenue, variable costs, and fixed costs for enrollment levels of 20, 25, 30 and 37 students using the monthly projections in Attachment A of the case. 2. Then, compute the weighted average contribution margin (CM) per student (computed as the total CM divided by the number of students enrolled) and 3. The number of students that need to enroll at each of the four levels of enrollment for the center to break even. For this analysis, I have provided an Excel template in which I have already sorted variable and fixed costs: I have included the raw data. Note: Your enrollment information has already been weighted so you will not need to calculate weights for your weighted average CM.arrow_forward
- Per given item (A to P), Identify if it is under Financial Perspective, Customer Perspective, Learning Perspective or Internal Perspective The following items are connected to one of the four perspectives on the balanced scorecard: A. Revenue B. Inventory C. Employee satisfaction D. Customer satisfaction E. Market share F. Cycle time G. Orders M. Net Income H. Asset value N. Resource Allocation . Customer retention J. Employee education K. Quality contral L Brand strength O. Employee turnover P. Cash Flowarrow_forwardReid Company would like to Implement a balanced scorecard performance measurement system. Its senior management team has assembled the measures shown below for possible Inclusion in its scorecard. Requlred: For each measure, Indicate by placing an X In the appropriate column whether It would most likely be classified In the learning and growth, Internal business process, customer, or financlal category of the company's balanced scorecard. Learning & Internal Business Process Item Growth Customer Financial Ex. Employee absenteeism rate X 1. Sales from new customers 2. Customer defection rate 3. Average fuel cost per sales dollar 4. Average number of workplace accidents per employee 5. Delivery cycle time 6. Average training hours per employee 7. Number of job applicants from under-represented groups Percent of customers that strongly agree with the statement 8. "Your employees treated me courteously." 9. Return on assets Percent of customers that strongly agree with the statement "Your…arrow_forwardQUESTION 1 For each of the balanced scorecard targets listed below, identify the matching perspective: Organizational learning and growth, Internal business processes, Customer, Financial. - A. B. C. D. Customer satisfaction survey improves to 4.5/5 - A. B. C. D. Customer retention is held above 70% - A. B. C. D. Customer hold time average below 2 minutes - A. B. C. D. Percentage of on time delivery over 95% - A. B. C. D. Employee turnover of below 20%. - A. B. C. D. Average employee training hours of over 20 per year. - A. B. C. D. Return on investment…arrow_forward
- A marketing professor at Givens College is interested in the relationship between hours spent studying and total points earned in a course. Data collected on 156 students who took the course last semester are provided in the tile MktHrsPts. Develop a scatter chart for these data. What does the scatter chart indicate about the relationship between total points earned and hours spent studying? Develop an estimated regression equation showing how total points earned is related to hours spent studying. What is the estimated regression model? Test whether each of the regression parameters β0 and β1 is equal to zero at a 0.01 level of significance. What are the correct interpretations of the estimated regression parameters? Are these interpretations reasonable? How much of the variation in the sample values of total point earned does the model you estimated in part (b) explain? Mark Sweeney spent 95 hours studying. Use the regression model you estimated in part (b) to predict the total points Mark earned.arrow_forwardClassify each of the performance measures below into the most likely of four balanced scorecard perspective it relates to: 1. Employee sustainability sessions attended 2. Operating cash flow 3. Number f new customers acquired 4. Net income 5. CO2 emissions 6. Number of days with no employee injuries 7. Number of customer complaints 8. Change in market sharearrow_forwardE7-34A Compute margin of safety and operating leverage (Learning Objective 5) Terry's Towing Service has a monthly target operating income of $30,000. Variable expenses are 40% of sales, and monthly fixed expenses are $7,500. Requirements 1. Compute the monthly margin of safety in dollars if the shop achieves its income goal. 2. Express Terry's margin of safety as a percentage of target sales. 3. What is Terry's operating leverage factor at the target level of operating income? 4. Assume that the company reaches its target. By what percentage will the company's operating income fall if sales volume declines by 12%?arrow_forward
- Classify the performance measures below into the most likely balanced scorecard perspective itrelates to. Label your answers using C (customer), P (internal process), I (innovation and growth), or F(financial). Number of days of employee absencesClassify the performance measures below into the most likely balanced scorecard perspective itrelates to. Label your answers using C (customer), P (internal process), I (innovation and growth), or F(financial). Number of days of employee absencesarrow_forwardThe balanced scorecard for a service company American Express Company is a major financial services company noted for its American Express card. Some of the performance measures used by the company on its balanced scorecard are listed below. a. For each measure, identify whether the measure best fits the learning and growth, internal processes, customer, or financial performance perspective of the balanced scorecard. Performance Measure Average card member spending Number of Internet features Cards in force Performance Perspective Number of merchant signings Earnings growth Number of new card launches Hours of credit consultant training Return on equity Investment in information technology Revenue growth Number of card choices b. From the list of measures, select the option that would be considered lagging indicators relative to the rest of the measures listed. Lagging indicators Lagging indicators Lagging indicatorsarrow_forward1. Consider a class in a business school where volume is measured by the number of students in the class. Would you say the operating leverage is high or low?Why?arrow_forward
arrow_back_ios
SEE MORE QUESTIONS
arrow_forward_ios
Recommended textbooks for you
 Financial And Managerial AccountingAccountingISBN:9781337902663Author:WARREN, Carl S.Publisher:Cengage Learning,
 Managerial AccountingAccountingISBN:9781337912020Author:Carl Warren, Ph.d. Cma William B. TaylerPublisher:South-Western College Pub
 Cornerstones of Cost Management (Cornerstones Ser...AccountingISBN:9781305970663Author:Don R. Hansen, Maryanne M. MowenPublisher:Cengage Learning
 Essentials of Business Analytics (MindTap Course ...StatisticsISBN:9781305627734Author:Jeffrey D. Camm, James J. Cochran, Michael J. Fry, Jeffrey W. Ohlmann, David R. AndersonPublisher:Cengage Learning
Financial And Managerial Accounting
Accounting
ISBN:9781337902663
Author:WARREN, Carl S.
Publisher:Cengage Learning,
Managerial Accounting
Accounting
ISBN:9781337912020
Author:Carl Warren, Ph.d. Cma William B. Tayler
Publisher:South-Western College Pub
Cornerstones of Cost Management (Cornerstones Ser...
Accounting
ISBN:9781305970663
Author:Don R. Hansen, Maryanne M. Mowen
Publisher:Cengage Learning
Essentials of Business Analytics (MindTap Course ...
Statistics
ISBN:9781305627734
Author:Jeffrey D. Camm, James J. Cochran, Michael J. Fry, Jeffrey W. Ohlmann, David R. Anderson
Publisher:Cengage Learning
Responsibility Accounting| Responsibility Centers and Segments| US CMA Part 1| US CMA course; Master Budget and Responsibility Accounting-Intro to Managerial Accounting- Su. 2013-Prof. Gershberg; Author: Mera Skill; Rutgers Accounting Web;https://www.youtube.com/watch?v=SYQ4u1BP24g;License: Standard YouTube License, CC-BY