
Excursions in Modern Mathematics (9th Edition)
9th Edition
ISBN: 9780134468372
Author: Peter Tannenbaum
Publisher: PEARSON
expand_more
expand_more
format_list_bulleted
Videos
Textbook Question
Chapter 7, Problem 40E
Find the MST of the network shown in Fig. 7-41 using Kruskal's algorithm, and give its weight.
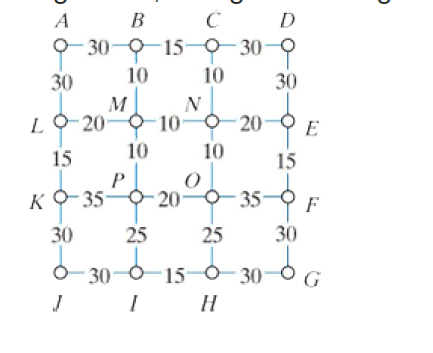
Figure7-41
Expert Solution & Answer

Trending nowThis is a popular solution!

Students have asked these similar questions
Coordinates for a clipping window and a line are given in the following figure. Use Liang-
Q1.
Barsky algorithm to clip this line with respect to the clipping window. Show your steps and calculations
clearly.
Ymax=20-
Po(8, 12)
Ymin=10
P1(30,6)
Xmin=10
Xmax=20
Information about ocean weather can be extracted from radar returns with the aid of a special algorithm. A
study is conducted to estimate the difference in wind speed as measured on the ground and via the Seasat
satellite. To do so, wind speeds (miles per hour) are measured on the ground and via the Seasat satellite
simultaneously at 12 special times. The data is shown in the following table. The table also shows the difference
between the wind speed on the ground and that via the Seasat satellite at each time, as well as some summary
statistics.
Difference
Time
Ground (x) Satellite (y)
d = x – y
1
4.46
4.08
0.38
3.99
3.94
0.05
3.73
5.00
-1.27
4
3.29
5.20
-1.91
4.82
3.92
0.90
6.
6.71
6.21
0.50
7
4.61
5.95
-1.34
8
3.87
3.07
0.80
9.
3.17
4.76
-1.59
10
4.42
3.25
1.17
11
3.76
4.89
-1.13
12
3.30
4.80
-1.50
d = -0.41
Sd = 1.14
A. Consider the line from (2,3) to (9,8). Use the Bresenham’s algorithm to rasterize this line.
Given the clipping window points x_min = 4, y_min = 4, x_max = 10, y_max = 8
Find the lines whether accepted or rejected line 1 : x1 = 5, y1 = 5, x2 = 7, y2 = 7, Line 2 : x1 = 7, y1 = 9, x2 = 11, y2 = 4, Line 3 : x1 = 1, y1 = 5, x2 = 4, y2 = 1
Chapter 7 Solutions
Excursions in Modern Mathematics (9th Edition)
Ch. 7 - A computer lab has seven computers labeled A...Ch. 7 - The following is a list of the electrical power...Ch. 7 - Consider the network shown in Fig.720_. a. How...Ch. 7 - Consider the network shown in Fig.721_. a. How...Ch. 7 - Consider once again the network shown in. Fig720_....Ch. 7 - Consider once again the network shown in. Fig721_....Ch. 7 - Consider the network shown in. Fig722. This is the...Ch. 7 - Consider the network shown in. Fig723_. This is...Ch. 7 - Consider the tree shown in. Fig724_. a. How many...Ch. 7 - Consider the tree shown in. Fig725. a. How many...
Ch. 7 - In Exercises 11 through 24 you are given...Ch. 7 - Prob. 12ECh. 7 - Prob. 13ECh. 7 - Prob. 14ECh. 7 - In Exercises 11 through 24 you are given...Ch. 7 - Prob. 16ECh. 7 - Prob. 17ECh. 7 - Prob. 18ECh. 7 - Prob. 19ECh. 7 - In Exercises 11 through 24 you are given...Ch. 7 - Prob. 21ECh. 7 - Prob. 22ECh. 7 - Prob. 23ECh. 7 - Prob. 24ECh. 7 - Prob. 25ECh. 7 - Consider the network shown in Fig.727_. a. Find a...Ch. 7 - Prob. 27ECh. 7 - Consider the network shown in Fig.729_. a. Find a...Ch. 7 - Prob. 29ECh. 7 - Prob. 30ECh. 7 - Prob. 31ECh. 7 - Prob. 32ECh. 7 - Prob. 33ECh. 7 - Prob. 34ECh. 7 - Prob. 35ECh. 7 - The 4 by 5 grid shown in Fig. 7-37 represents a...Ch. 7 - Prob. 37ECh. 7 - Find the MST of the network shown in Fig. 7-39...Ch. 7 - Find the MST of the network shown in Fig. 7-40...Ch. 7 - Find the MST of the network shown in Fig. 7-41...Ch. 7 - Prob. 41ECh. 7 - Find the MaxST of the network shown in Fig. 7-39...Ch. 7 - Find the MaxST of the network shown in Fig. 7-40...Ch. 7 - Prob. 44ECh. 7 - The mileage chart in Fig. 742 shows the distances...Ch. 7 - Figure 7-43a shows a network of roads connecting...Ch. 7 - Prob. 47ECh. 7 - Prob. 48ECh. 7 - Prob. 49ECh. 7 - This exercise refers to weighted networks where...Ch. 7 - Prob. 51ECh. 7 - Prob. 52ECh. 7 - Prob. 53ECh. 7 - Prob. 54ECh. 7 - Prob. 55ECh. 7 - Prob. 56ECh. 7 - A bipartite graph is a graph with the property...Ch. 7 - Prob. 58ECh. 7 - Prob. 59E
Knowledge Booster


Learn more about
Need a deep-dive on the concept behind this application? Look no further. Learn more about this topic, subject and related others by exploring similar questions and additional content below.Similar questions
- Solve the shortest path problems shown in the attached picture by hand using the original implementation of Dijkstra's algorithm. Count the number of distance updates, provide the shortest path solution and the hand-drawn trees of shortest paths for (a) and (b).arrow_forwardConsider the graph below. How many total tables will there be for the Distance Vector algorithm and what will the size of the table be for Node E? b 5 12 10 d f 5 7 tables and Node E's table is 5x7 4 tables and Node E's table is 7x7 8 tables and Node E's table is 7x7 4 tables and Node E's table is 4x7 16 8arrow_forwardVw QUESTION 10 9. Please use the graph below to show that Dijkstra's algorithm cannot be used if the graph has negative edges. Source = A 3. 1. For the toolbar, press ALT+F10 (PC) or ALT+FN+F10 (Mac). Paragraph 10pt Arial 田国 出田回 BIUSarrow_forward
arrow_back_ios
arrow_forward_ios
Recommended textbooks for you
 Algebra & Trigonometry with Analytic GeometryAlgebraISBN:9781133382119Author:SwokowskiPublisher:Cengage
 Linear Algebra: A Modern IntroductionAlgebraISBN:9781285463247Author:David PoolePublisher:Cengage Learning
Algebra & Trigonometry with Analytic Geometry
Algebra
ISBN:9781133382119
Author:Swokowski
Publisher:Cengage
Linear Algebra: A Modern Introduction
Algebra
ISBN:9781285463247
Author:David Poole
Publisher:Cengage Learning
Graph Theory: Euler Paths and Euler Circuits; Author: Mathispower4u;https://www.youtube.com/watch?v=5M-m62qTR-s;License: Standard YouTube License, CC-BY
WALK,TRIAL,CIRCUIT,PATH,CYCLE IN GRAPH THEORY; Author: DIVVELA SRINIVASA RAO;https://www.youtube.com/watch?v=iYVltZtnAik;License: Standard YouTube License, CC-BY