
The effect of change in the
Explanation of Solution
The Elasticity of
Social surplus is the sum total of both
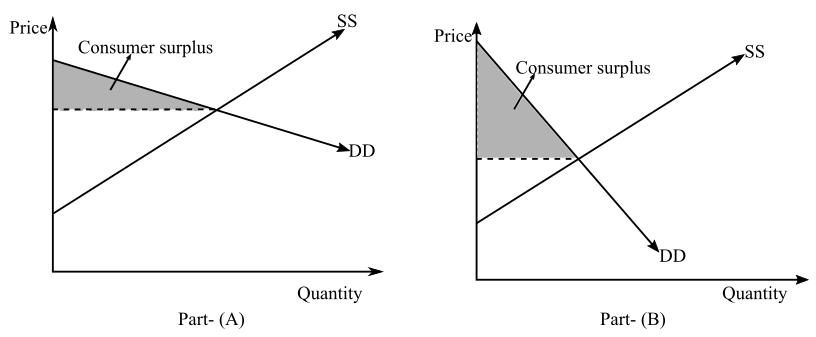
In part (a) of the above diagram, DD is the demand and elastic demand curve, SS is the supply curve, and the
So, if the elasticity of demand is higher, consumer surplus will be lower as what a consumer is willing to pay becomes equal to what they actually pay.
Thus, the social surplus will also be lower as it consists of consumer surplus.
Similarly,
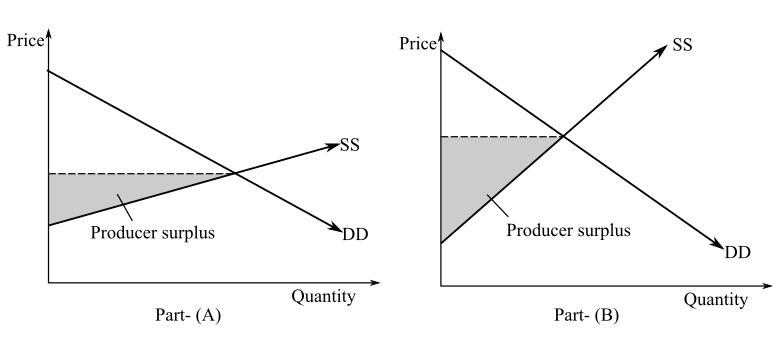
DD is the demand curve, SS is the elastic supply curve and the equilibrium price is where DD and SS intersect. Producer surplus is calculated between the price and above the supply curve, which means the higher the elasticity of supply, the lower is the producer surplus which will decrease social surplus. As the elasticity of supply increases, producer surplus also increases as shown in part ( b ) of the diagram, which will increase social surplus.
Want to see more full solutions like this?
Chapter 7 Solutions
Pearson eText Microeconomics -- Access Card

- At 10 million hours, what areas make up the total economic surplus in this market?arrow_forwardUse the following graph to answer the question: how much is producer surplus? What is the total value to consumers of consuming the first ten units of this good? Use the following graph to answer the question: how much is producer surplus? What is the total value to consumers of consuming the first ten units of this good?arrow_forwardSuppose the supply curve of a good is given by, and the demand curve of a good is given by. What happens to the equilibrium price and quantity after the government taxes suppliers $2 for each unit of production? (Hint: Graph what the new supply curve would look like, and see which answer best makes sense.) A...The supply curve changes to the equilibrium quantity goes down, and the equilibrium price goes up. 2 B...The supply curve changes to the equilibrium quantity goes down, and the equilibrium price goes up. " C...The supply curve changes to the equilibrium quantity goes up, and the equilibrium price goes down. " D...The supply curve changes to the equilibrium quantity goes down, and the equilibrium price goes up. 2arrow_forward
- On the market for cherries, supply is inelastic, while demand is elastic. You know that suppliers are not ready to supply any cherries when the price is below $1.5 per pound. a) On a graph, show the equilibrium price and the equilibrium quantity. Make sure you label the axes and the curves. Then, show the consumer surplus and the producer surplus. b) Strawberries and cherries are substitutes. The price of strawberries increased. On a graph,show what will happen on the market for cherries. Show the change in the consumer surplus. Show the change in the producer surplus. c) Forget about part (b). There are issues with the supply chain: transportation companies raise the fees they charge to deliver cherries from the farms to the supermarkets. On a graph, show what will happen on the market for cherries. Show the change in the consumer surplus. Show the change in the producer surplusarrow_forwardCan consumer surplus be zero? If yes then in what scenario does this happen?arrow_forwardSketch out (on scratch paper) or else imagine a market for pizza with a linear demand curve that starts at zero Q-demanded when P =$10 and then intersects Supply at P = $8 Q = 100. Find the consumer surplus for that scenario. Just the $ amount but no $ sign.arrow_forward
- When both supply and demand increase for a certain good, what would happen to the equilibrium price and quantity of the good?arrow_forwardNew York City has a long-standing policy of controlling rents in certain parts of the city—in essence,a price ceiling on rent. Is the market for apartmentslikely to be efficient or inefficient? What does thisimply for the size of total surplus?arrow_forward14. Over the past few year’s consumer tastes and the number of buyers in the market for a game called ‘pickle ball’ have increased dramatically. Thus, the demand for tickets to pickle ball events has increased. Before this all started the equilibrium price of a ticket to a pickle ball event was negative. This means that: A few years ago, there would have been a surplus of tickets even at a price of zero, now the invisible hand has pushed prices to greater than zero. A few years ago, the quantity of tickets demanded was less than quantity supplied. Pickle ball event tickets resembled the market for recyclable cardboard a few years ago Greater demand for pickle ball tournament tickets will lead to a greater demand – and higher pay – for professional pickle ball players. All of the above. B and D onlyarrow_forward
- Is The following graph plots the supply and demand curves in the market for VR headsets. Use the black point (plus symbol) to indicate the equilibrium price and quantity of VR headsets. Then use the green point (triangle symbol) to fill the area representing consumer surplus, and use the purple point (diamond symbol) to fill the area representing producer surplus. PRICE (Dollars per headset) 400 300 320 200 240 200 160 120 BO 40 0 0 Demand Supply 75 400 525 600 676 750 150 225 300 375 QUANTITY (Millions of headsets) Total surplus in this market is $ million, Equilibrium A Consumer Surplus ◊ Producer Surplus Bas & Pant course 0xarrow_forwardSuppose the demand for calendars increases in November. At the same time, the price of the ink used in the production of calendars increases. In the market for calendars, if the size of the shift of the demand curve is larger than the size of the shift of the supply curve, then the equilibrium quantity rises.” Is this correct or not? Why?arrow_forwardGraphically, how is consumer surplus measured? by the area below the demand curve, but above the market price by the area below the demand curve, but above the upward-sloping supply curve by the area below the market demand curve, but above the supply curve by the area below the demand curvearrow_forward
 Economics (MindTap Course List)EconomicsISBN:9781337617383Author:Roger A. ArnoldPublisher:Cengage Learning
