
Concept explainers
To develop: Appropriate control chart and determine whether there is any cause for concern in the cutting process.
Introduction: Control charts used to determine whether the process is under control or not. Attributes and variables are the factors under the control charts.
Explanation of Solution
Given information:
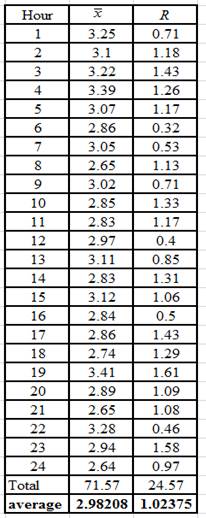
The following information is given:
Develop appropriate control chart:
To check whether the process is in control, create the appropriate control charts for the mean
Determine mean of the averages:
It can be calculated by taking the average of all given values for
Hence, the mean of averages
Determine mean of the ranges:
It can be calculated by taking the average of all given values for R.
Hence, the mean of ranges is
Determine the upper control limit and lower control limit of
Determine the upper control limit (UCL) and the lower control limit (LCL) of the
Here, the overall mean
Given the sample size of 4, the Mean factor is
Substitute into the equation (1),
Substitute into the equation (2),
Hence, the upper control limit is
Determine the upper control limit and lower control limit of
Determine the upper control limit (UCLR) and lower control limit (LCLR) of the
Here,
Given the sample size of 4 for
Substitute into the equation (3),
Similarly, substitute in equation (4),
Hence, the upper control limit is
Draw the control chart for the sample means:
The process mean is
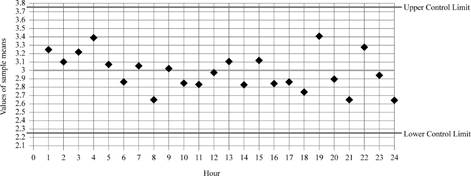
Observe that all the sample means are well within the control limits. The first five observations are above the mean of the averages.
Draw the control chart for the sample range:
The average range is
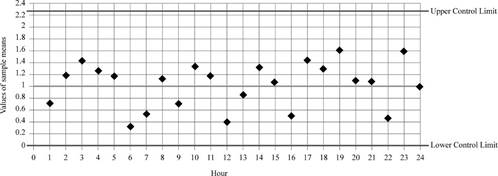
Observe that all the sample ranges are well within the control limits
Hence, the process seems to be in “statistical control”. (However, a process for making precision wires obviously should not have so much of variation in the mean or in the range.)
Want to see more full solutions like this?
Chapter 6 Solutions
EBK PRINCIPLES OF OPERATIONS MANAGEMENT


- Why is it important to prove that a process is proven capable before developing statistical control limits (i.e., SPC charts)?arrow_forwardExplain how to contruct process control chart and use them to determine whether a process is out of statistical control.arrow_forwardDescribe how to construct process control charts and use them to determine whether a process is out of statistical control.arrow_forward
- Construct a 3-sigma X-bar chart for the length in centimeters of a part from the following tabble . What is the upper controt limit? sample observation 1 observation 2 observation 3 observation 4 1 0.486 0.499 0.493 0.511 2 0.499 0.506 0.516 0.494 3 0.496 0.5 0.515 0.488 4 0.495 0.506 0.483 0.487 5 0.472 0.502 0.526 0.469 6 0.473 0.495 0.507 0.493 7 0.495 0.512 0.49 0.471 8 0.525 0.501…arrow_forwardCheckout time at a supermarket is monitored using a mean and a range chart. Six samples of n = 20 observations have been obtained and the sample means and ranges computed: Sample Mean Range Sample Mean Range 1 3.06 .42 4 3.13 .46 2 3.15 .50 5 3.06 .46 3 3.11 .41 6 3.09 .45 a. Using the factors in Table 10.3 , determine upper and lower limits for mean and range charts. b. Is the process in control?arrow_forwardDevelop a Pareto chart of the following causes of poor grades on an exam:arrow_forward
- In a fabric manufacturing factory, the quality control process using control charts from SPC. In an hour there are a total of 5 samples are taken each having 5 observations regarding the thickness of fabric in measured in millimeters In a particular hour, the sample means (X-bar) are noted to be: 172.11, 219.58, 208.24, 112.44, and 123.30 respectively. In the same sample, the corresponding ranges are: 13.17, 3.38, 15.34, 13.0 , and 13.02 respectively What are the lower and upper control limits for the X-bar chart? a . 157.21 , 177.05 b. 146.01, 157.87 c. 159.25, 175.02 d. 142.92, 160.66 e. 143.55, 165.47 f. None is correctarrow_forwardExplain how a person using 2-sigma control charts will more easily find samples “out of bounds” than 3-sigma control charts. What are some possible consequences of this fact?arrow_forwardExplain how can a Pareto chart used to improve quality?arrow_forward
- What is a P-chart used for?arrow_forwardExplain what might cause a process to be out of control in managing quality ?arrow_forwardA local steel pipe manufacturing company makes pipes. In a quality control assessment, a total of five (05) samples are collected with four (04) observations within each sample. The sample means (X-bar) are; 14.09, 13.94, 16.86, 18.77, and 16.64 respectively. Next, the corresponding ranges are; 9.90, 7.73, 7.89, 7.56, and 5.50 respectively. The lower and upper control limits of the R-chart are_ respectively Oa. None is correct O b. 0,16.68 O c. 0, 17.59 O d. 0,17.32 O e. 1, 10.5arrow_forward
 Practical Management ScienceOperations ManagementISBN:9781337406659Author:WINSTON, Wayne L.Publisher:Cengage,
 Operations ManagementOperations ManagementISBN:9781259667473Author:William J StevensonPublisher:McGraw-Hill Education
 Operations and Supply Chain Management (Mcgraw-hi...Operations ManagementISBN:9781259666100Author:F. Robert Jacobs, Richard B ChasePublisher:McGraw-Hill Education
 Purchasing and Supply Chain ManagementOperations ManagementISBN:9781285869681Author:Robert M. Monczka, Robert B. Handfield, Larry C. Giunipero, James L. PattersonPublisher:Cengage Learning
 Production and Operations Analysis, Seventh Editi...Operations ManagementISBN:9781478623069Author:Steven Nahmias, Tava Lennon OlsenPublisher:Waveland Press, Inc.