
a.
To draw: The labeled graph on which the equilibrium interest rate and equilibrium quantity of loanable funds can be represented.
a.
Explanation of Solution
Calculation:
Graph showing equilibrium interest rate and equilibrium quantity of loanable funds which is as follows:
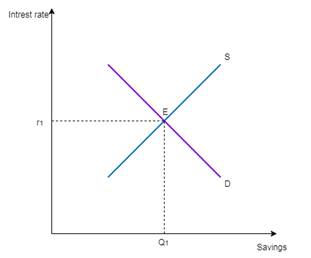
Graph 1
Loan-able funds market: Loan-able funds markets represent the place where the behavior of savers and borrowers can be predicted.
b.
To show: The effect of increased government deficit in the loan-able fund market with the label of new equilibrium interest rate and quantity of loan-able funds.
b.
Explanation of Solution
Graph showing effect of increased government deficit in loan able fund market which is as follows:
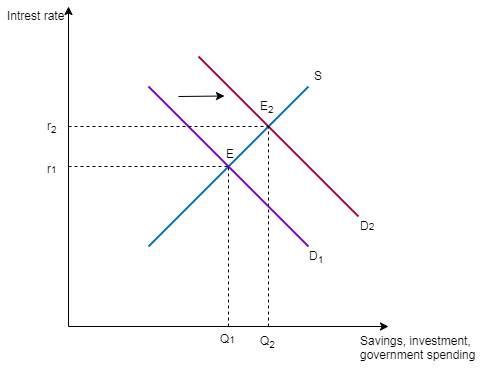
Graph 2
Therefore, an increased government deficit will shift the demand curve towards the right.
Loan-able funds market: Loan-able funds markets represent the place where the behavior of savers and borrowers can be predicted.
Chapter 6R Solutions
Krugman's Economics For The Ap® Course


 Principles of Economics (12th Edition)EconomicsISBN:9780134078779Author:Karl E. Case, Ray C. Fair, Sharon E. OsterPublisher:PEARSON
 Engineering Economy (17th Edition)EconomicsISBN:9780134870069Author:William G. Sullivan, Elin M. Wicks, C. Patrick KoellingPublisher:PEARSON
 Principles of Economics (MindTap Course List)EconomicsISBN:9781305585126Author:N. Gregory MankiwPublisher:Cengage Learning
 Managerial Economics: A Problem Solving ApproachEconomicsISBN:9781337106665Author:Luke M. Froeb, Brian T. McCann, Michael R. Ward, Mike ShorPublisher:Cengage Learning
 Managerial Economics & Business Strategy (Mcgraw-...EconomicsISBN:9781259290619Author:Michael Baye, Jeff PrincePublisher:McGraw-Hill Education