
Concept explainers
Videos
Cost Behaviour; High4æw Method; Contribution Format Income Statement LOS−10
Morrisey& Brown, Ltd of Sydney j a merchandising company that is the sole distributor product that is increasing in popularity among Australian consumers, The Company’s income statements for the three most recent months follow: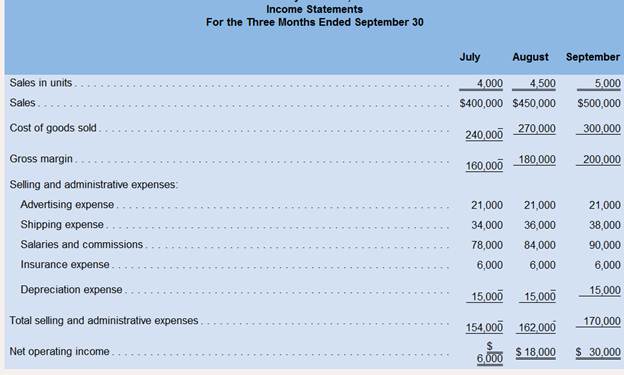
Required:
1. By ana1vzm the data from the company’s income statements, classify each of its expenses (including cost of goods sold) as either variable, fixed, or mixed.
2. Using the high-low method, separate each mixed expense into variable and fixed elements. Express the variable and fed portions of each mixed expense in the form Y = a + bX.
3. Redo the company’s income statement at the 5,000-unit level of activity using the contribution format.
High−Low Method: It is one of the methods distribution of cost used to split the mixed cost into fixed cost and variable cost.
1. The classification of expenses into variable, fixed, or mixed from the data given in the income statement.
2. The variable and fixed elements from the mixed expenses using the high-low method.
3. The contribution format income statement at the 5,000 unit level of activity.
Answer to Problem 7P
Solution:
1.
| Expenses | Classification |
| Cost of goods sold | Variable |
| Advertising expenses | Fixed |
| Shipping expenses | Mixed |
| Salaries and commissions | Mixed |
| Insurance expense | Fixed |
| Depreciation expenses | Fixed |
2. The total cost equation for shipping expenses is
The total cost equation for Salaries and Commissions is
3.
| Morrisey & Brown, Ltd
Contribution Format Income Statement | ||
| Sales | $500,000 | |
| Variable expenses: | ||
| Cost of goods sold | $300,000 | |
| Shipping expenses | $20,000 | |
| Salaries and commissions | $60,000 | |
| Total variable expenses | $380,000 | |
| Contribution margin | $120,000 | |
| Fixed expenses: | ||
| Advertising expenses | $21,000 | |
| Shipping expenses | $18,000 | |
| Salaries and commissions | $30,000 | |
| Insurance expenses | $6,000 | |
| Depreciation expenses | $15,000 | |
| Total fixed expenses | $90,000 | |
| Net operating income | $30,000 | |
Explanation of Solution
1. If the total amount of any expenses does not changes at different level of sales, it is a fixed expenses and if the total amount of any expenses changes at different level of sales, it is a variable expenses or mixed expenses. The combination of fixed and variable expenses is called a mixed expense.
2.
Applying High-low method to Shipping expenses (Mixed expenses)
| Units | Shipping
Expenses | |
| High Activity level | 5,000 | $38,000 |
| Low Activity level | 4,000 | $34,000 |
| Change | 1,000 | $4,000 |
Computation of Fixed cost at highest level of activity
Applying High-low method to Salaries and commissions expenses (Mixed expenses)
| Units | Shipping
Expenses | |
| High Activity level | 5,000 | $90,000 |
| Lowest Activity level | 4,000 | $78,000 |
| Change | 1,000 | $12,000 |
Computation of fixed cost at highest level of activity
3. The mixed expenses are distributed according to the variable and fixed elements based upon the figures computed by High-low Method. The variable expenses are $4 for shipping expenses and $12 for salaries and commissions. The fixed expenses are $18,000 for shipping expenses and $30,000 for salaries and commissions. The fixed expenses and variable expenses per unit will always remain the same for any level of sale.
Given:
| Morrisey & Brown, Ltd.
Income Statements For the Three Ended September 30 | |||
| Sales units | 4,000 | 4,500 | 5,000 |
| Sales | $400,000 | $450,000 | $500,000 |
| Cost of goods sold | $240,000 | $270,000 | $300,000 |
| Gross margin | $160,000 | $180,000 | $200,000 |
| Selling and administrative expenses: | |||
| Advertising expenses | $21,000 | $21,000 | $21,000 |
| Shipping expenses | $34,000 | $36,000 | $38,000 |
| Salaries and commissions | $78,000 | $84,000 | $90,000 |
| Insurance expenses | $6,000 | $6,000 | $6,000 |
| Depreciation expenses | $15,000 | $15,000 | $15,000 |
| Total selling and administrative expenses | $154,000 | $162,000 | $170,000 |
| Net operating income | $6,000 | $18,000 | $30,000 |
It is concluded that the Morrisey & Brown, have two mixed expenses which are shipping expenses and salaries expenses. A mixed expense can be identified by finding the change in percentage of the expense. Usually a variable expenses changes according to the change in the sales. So it means that the percentage change in sales will always be equal to percentage change in variable expenses. Hence if the percentage change in an expense is not equal to percentage change in sales, it is known as a mixed expenses.
Want to see more full solutions like this?
Chapter 6 Solutions
INTRO MGRL ACCT LL W CONNECT


- Summarized data for Walrus Co. for its first year of operations are: A. Prepare an income statement under absorption costing B. Prepare an income statement under variable costingarrow_forwardNumber of units sold. Selling price per unit Unit cost of goods sold Variable selling expense per unit Total fixed selling expense Variable administrative expense per unit Total fixed administrative expense Cost of goods sold is a variable cost in this company. Required: a. Prepare a traditional format income statement for July. b. Prepare a contribution format income statement for July. Complete this question by entering your answers in the tabs below. 6,400 $ 600 $416 $ 56 $ 125,900 $ 24 $ 207,800arrow_forwardThe cost of goods sold and shipping expense are both variable. All other costs are fixed. Required: 3. Prepare a new contribution format segmented income statement for May. (Round percentage answers to 1 decimal place.)arrow_forward
- QUESTION 2 (a) Explain the following terms: (1) margin of safety (ii) contribution margin (b) contribution to sales ratio (ii) (iv) (c) cost behaviour in a linear function (v) (d) break even analysis The Income statement for the year ending 31 December 2020 for Hagemaru Manufacturing is as follows: RM'000 RM'000 Sales (22,000 units) 3,300 Direct materials 726 Direct labour 374 Production overheads 798 (1,898) Gross profit 1,402 Selling overheads (1,042) Net profit 360 The variable production overheads were RM9 per unit while the variable selling overheads were RM11 per unit. Required: (i) Calculate contribution margin per unit. (i) (ii) Calculate breakeven point in units and in RM. (i) Calculate margin of safery in units for the latest financial year. The company has a capacity of 30,000 units per year. Management is not happy with the financial performance for the last year, and two courses of (iv) (v) (vi) action for the coming year were proposed in the recent management meeting:…arrow_forwardThe following information is available for Concord Company: Sales Total fixed expenses Cost of goods sold Total variable expenses $301000 $51600 103200 86000 What amount would you find on Concord's CVP income statement? General 41:18 O gross profit of $197800 • contribution margin of $163400 O contribution margin of $215000 O gross profit of $163400arrow_forward4. Compute gross profit earned by the company for each of the four costing methods. (Round your average cost per unit to 2 decimal places.) Sales Less: Cost of goods sold Gross profit FIFO LIFO Weighted Average Specific Identificationarrow_forward
- Smithen Company, a wholesale distributor, has been operating for only a few months. The company sells three products-sinks, mirrors, and vanities. Budgeted sales by product and in total for the coming month are shown below based on planned unit sales as follows: Sinks Mirrors Vanities Total Units 1,000 500 500 2,000 Percentage of total sales Sales Variable expenses Contribution margin Contribution margin per unit Fixed expenses Operating income Break-even point in unit sales: Percentage sex 25% 25% 100% Break-even point in sales dollars: Total Fixed expenses. Weighted-average CM per unit Sinks 48% Product Mirrors 20% $264,000 100.00% $110,000 100.00% $176,000 100.00% $550,000 100.00% 80,000 30.30% 72,000 65.45% 82,000 46.59% 219,300 39.87% 53.41% 60.13% $184,000 $ 94,000 330,700 69.70% 38,000 34.55% S 76.00 $ 184.00 $ 188.00 Fixed expenses Overall CM ratio $293,300 $158.00 Vanities 32% $293,300 0.60 1,856.33 units Total 100% 293,300 $ 37,400 = $487,798.61 *($184.00 0.50) + ($76.00 x…arrow_forwardFruitas InG (Fruitas) Fruitas has the following segment information: Pastry, Fruit Juices & Desserts, and Fast Food. In 2022, the total common fixed expenses amounted to 175,540 (in thousands). Data concerning the company's segmented income statement performance for the year ended December 31, 2022, is as follows: Fruitas, Inc. Contribution For mat Segmented In come Statement For the year ended 31 December, 2022 Required: Assume that the business head of the Fast Food segment has proposed the following: Proposal no. 1 is to run promotions to improve customer recognition. The promotions will run for a year for a total cost of 35 million. The business head expects sales to increase by 20% during the same year when the promotion is run but expects to impact sales significantly during the following years from sales from repeat customers. Proposal no. 2 is to source cheaper raw materials to save on food costs. When implemented, the business head expects variable expenses to decrease by 5%.…arrow_forward7. Which one of these is not an objective of cost accounting? a.Assisting shareholders in decision making b.Cost control and reduction c.Ascertainment of cost d.Determination of selling price 8. Calculate EOQ from the following details: Consumption per month is 2,000 units, ordering cost is RO 10 per order, purchase price is RO 100 per unit and annual carrying cost is 6%. a.283 units b.245 units c.219 units d.310 unitsarrow_forward
- Complete this question by entering your answers in the tabs below. Req 1A Req 1B Req 2A Req 2B Assuming the sales mix given above, prepare a contribution format income statement showing both dollar and percent columns for e for the company as a whole. $ Island Novelties, Inc., Contribution Income Statement Hawaiian Fantasy Amount % 0 % % 0% $ Total Amount 0 0 % % % 0 %arrow_forwardFill in the missing amounts in each of the eight case situations below. Each case is independent of the others. (Hint: One way to find the missing amounts would be to prepare a contribution format income statement for each case, enter the known data, and then compute the missing items.) Required: a. Assume that only one product is being sold in each of the following four case situations: Unit sold Sales Variable expenses Foxed expenses Operating income (loss) Contribution margin per unit $ Case #1 15,000 180,000 $ 100,000 120,000 50,000 $ $ Case #2 Case #1 Case #3 10,000 Case #2 70,000 $ 32,000 8,000 $ 12,000 $ 10 $ 13 Case #4 b. Assume that more than one product is being sold in each of the following four case situations: (Enter "Contribution margin ratio" in percent. Round your final answers to the nearest whole dollar amount.) Case #3 6,000 300,000 100,000 (10,000) Case #4arrow_forwardA company produces and sells the following quantites of a product: Date Number of tons Total CostsJuly 1 Opening Inventory 10 P200 4 Production 8 176 6 Sale 9 15 Production 6 144 18 Sale 11 23 Production 4 104 Question:Which statement is true? A. Cost of goods sold using FIFO is higher than cost of goods sold using weighted average. B. Profit using FIFO is higher than profit using weighted average. C. Total assets at July 31 is higher using weighted average than total assets using FIFO. D. Profit is not affected by the costing method used to measure inventory.arrow_forward
 Cornerstones of Financial AccountingAccountingISBN:9781337690881Author:Jay Rich, Jeff JonesPublisher:Cengage Learning
 Principles of Accounting Volume 2AccountingISBN:9781947172609Author:OpenStaxPublisher:OpenStax College