Concept explainers
Videos
Milk Production The data in the table below represent the number of dairy farms [in thousands) and the amount of milk produced (in billions of pounds) in the United States for various years.
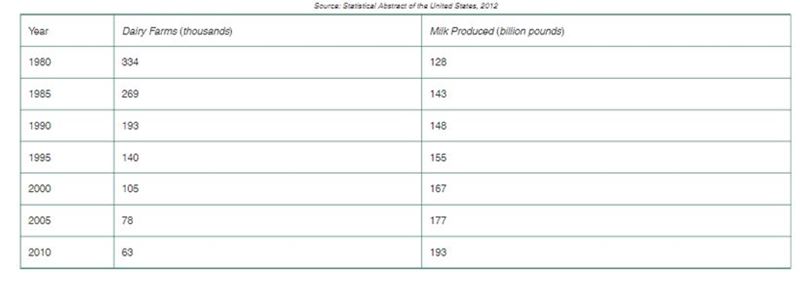
a. Using a graphing utility, draw a
b. Using a graphing utility, build a logarithmic model from the data.
c. Graph the logarithmic function found in part (b) on the scatter diagram.
d. In 2008, there were 67 thousand dairy farms in the United States. Use the function in part(b) to predict the amount of milk produced in 2008.
e. The actual amount of milk produced in 2008 was 190 billion pounds. How does your prediction in pad (d) compare to this?
Want to see the full answer?
Check out a sample textbook solution
Chapter 6 Solutions
College Algebra (10th Edition)
Additional Math Textbook Solutions
Elementary Algebra: Concepts and Applications (10th Edition)
Differential Equations and Linear Algebra (4th Edition)
Elementary Linear Algebra (Classic Version) (2nd Edition) (Pearson Modern Classics for Advanced Mathematics Series)
Intermediate Algebra (12th Edition)
Introduction to Linear Algebra (Classic Version) (5th Edition) (Pearson Modern Classics for Advanced Mathematics Series)
Algebra And Trigonometry (11th Edition)


- Enter the data from Table 2 into a graphing calculator and graph the ranking scatter plot. Determine whetherthe data from the table would likely represent a function that is linear, exponential, or logarithmic.arrow_forwardWhat type (s) of translation (s), if any, affect thedomain ofa logarithmic function?arrow_forwardWhat might a scatterplot of data points look like if it were best described by a logarithmic model?arrow_forward
- Does a linear, exponential, or logarithmic model best fit the data in Table 2? Find the model.arrow_forwardHuman Memory Model Students in a learning theory study took an exam and then retested monthly for 6 months with an equivalent exam. The data obtained in the study are given by the ordered pairs t,s, where t is the time (in months) after the initial exam and s is the average score for the class. Use the data to find a logarithmic equation that relates t and s. 1,84.2,2,78.4,3,72.1,4,68.5,5,67.1,6,65.3arrow_forward

 Trigonometry (MindTap Course List)TrigonometryISBN:9781337278461Author:Ron LarsonPublisher:Cengage Learning
 College Algebra (MindTap Course List)AlgebraISBN:9781305652231Author:R. David Gustafson, Jeff HughesPublisher:Cengage Learning
 Big Ideas Math A Bridge To Success Algebra 1: Stu...AlgebraISBN:9781680331141Author:HOUGHTON MIFFLIN HARCOURTPublisher:Houghton Mifflin Harcourt
 Algebra & Trigonometry with Analytic GeometryAlgebraISBN:9781133382119Author:SwokowskiPublisher:Cengage