Videos
Write an inequality that represents each graph.
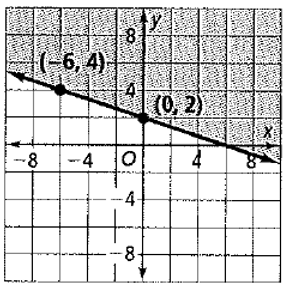
To write: The inequality that represents given graph.
Explanation of Solution
Given information:
The given graph is shown in Figure-1.
Method/ Formula used:
Find the equation of line representing boundary of the graph.
Equation of lie passing through points
Calculations:
The points
The shaded region lies on the right of the line
Hence, the inequalities that representing given graph is
Test:
Suppose
The point
Conclusion:
The inequalities that representing given graph is
Chapter 6 Solutions
High School Math 2012 Common-core Algebra 1 Practice And Problem Solvingworkbook Grade 8/9
Additional Math Textbook Solutions
Intermediate Algebra for College Students (7th Edition)
Elementary Algebra
College Algebra (10th Edition)
College Algebra with Modeling & Visualization (6th Edition)
College Algebra (6th Edition)


 Algebra and Trigonometry (6th Edition)AlgebraISBN:9780134463216Author:Robert F. BlitzerPublisher:PEARSON
 Contemporary Abstract AlgebraAlgebraISBN:9781305657960Author:Joseph GallianPublisher:Cengage Learning
 Linear Algebra: A Modern IntroductionAlgebraISBN:9781285463247Author:David PoolePublisher:Cengage Learning
 Algebra And Trigonometry (11th Edition)AlgebraISBN:9780135163078Author:Michael SullivanPublisher:PEARSON
 Introduction to Linear Algebra, Fifth EditionAlgebraISBN:9780980232776Author:Gilbert StrangPublisher:Wellesley-Cambridge Press
 College Algebra (Collegiate Math)AlgebraISBN:9780077836344Author:Julie Miller, Donna GerkenPublisher:McGraw-Hill Education