
Videos
The paper “Good for Women, Good for Men, Bad for People: Simpson’s Paradox and the Importance of Sex-Specific Analysis in Observational Studies” (Journal of Women’s Health and Gender-Based Medicine [2001]: 867-872) described the results of a medical study in which one treatment was shown to be better for men and better for women than a competing treatment. However, if the data for men and women are combined, it appears as though the competing treatment is better.
To see how this can happen, consider the accompanying data tables constructed from information in the paper. Subjects in the study were given either Treatment A or Treatment B, and survival was noted. Let S be the
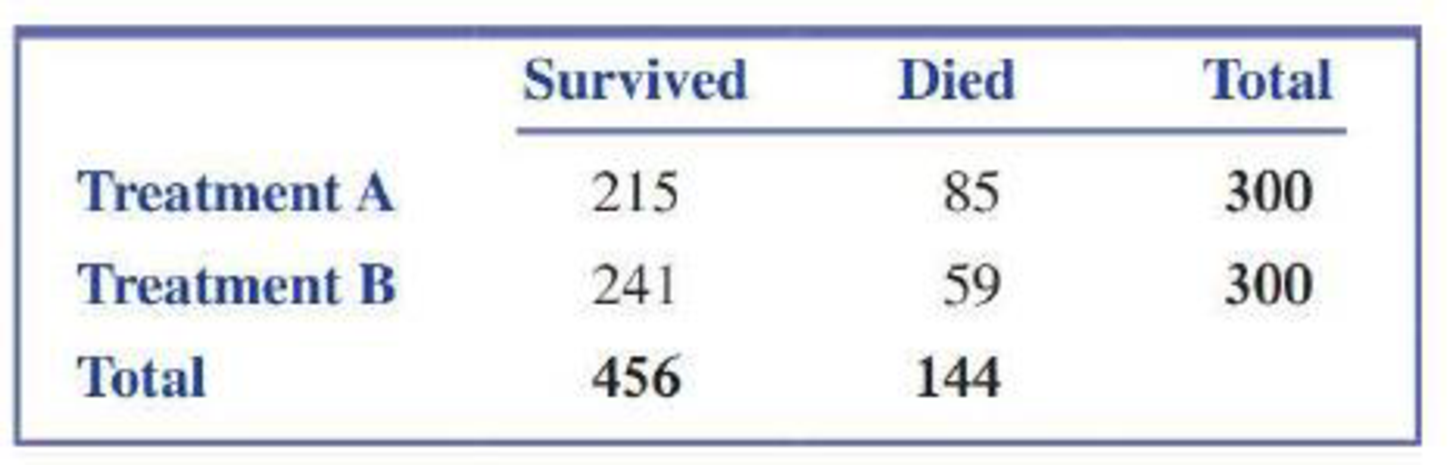
- a. The following table summarizes data for men and women combined:
- i. Find P(S).
- ii. Find P(S|A).
- iii. Find P(S|B).
- iv. Which treatment appears to be better?
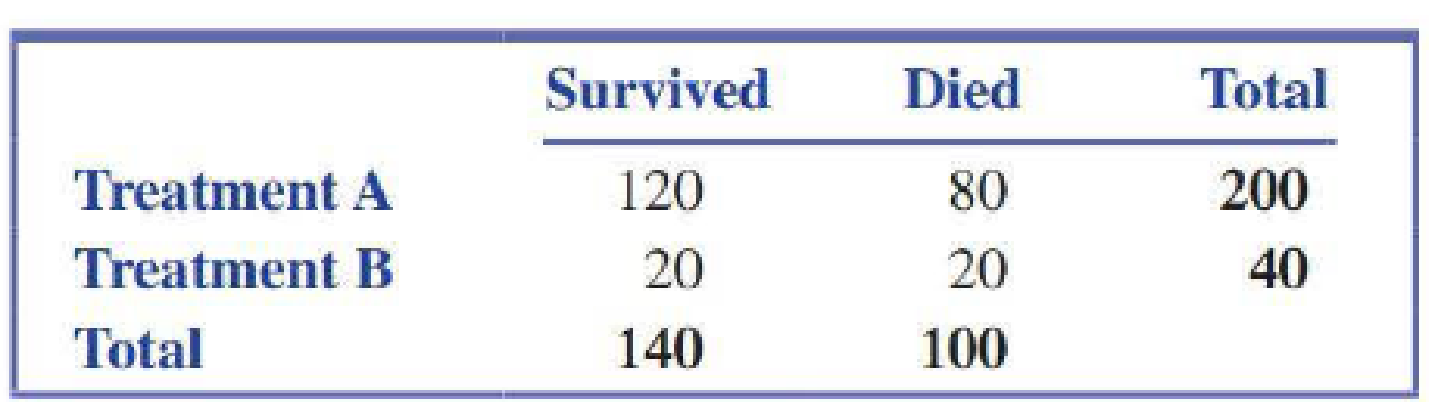
- b. Now consider the summary data for the men who participated in the study:
- v. Find P(S).
- vi. Find P(S|A).
- vii. Find P(S|B).
- viii. Which treatment appears to be better?
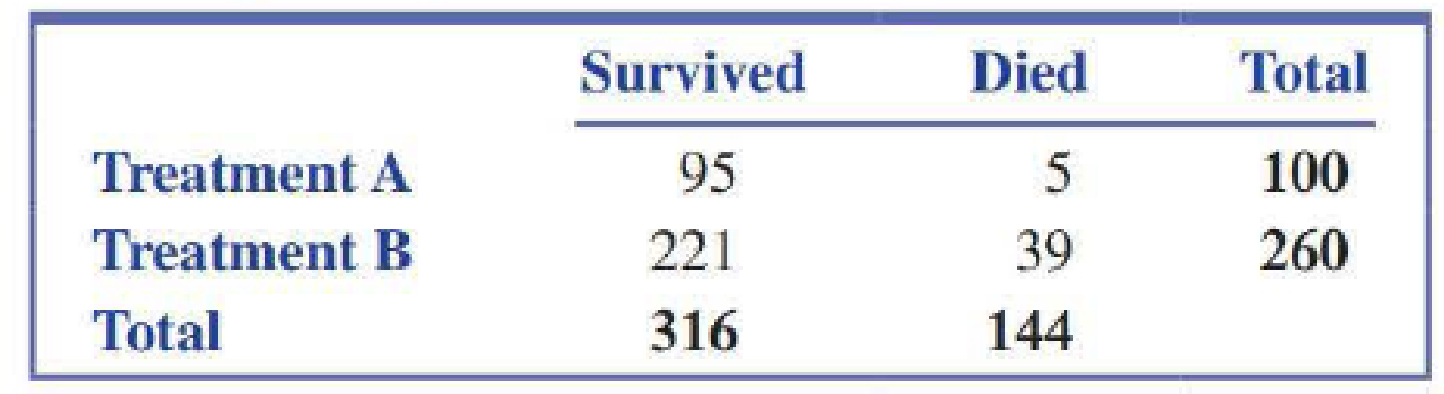
- c. Now consider the summary data for the women who participated in the study:
- ix. Find P(S). looks like Treatment B is better. This is an
- x. Find P(S|A).
- xi. Find P(S|B).
- xii. Which treatment appears to be better?
- d. You should have noticed from Parts (b) and (c) that for both men and women, Treatment A appears to be better. But in Part (a), when the data for men and women are combined, it looks like Treatment B is better. This is an example of what is called Simpson’s paradox. Write a brief explanation of why this apparent inconsistency occurs for this data set. (Hint: Do men and women respond similarly to the two treatments?)
a.
i. Compute
ii. Obtain
iii. Calculate
iv. Find the better treatment.
Answer to Problem 52E
i. The value of
ii. The value of
iii. The value of
iv. Treatment B is better than Treatment A.
Explanation of Solution
Calculation:
The given information is the summary table of the survey. Event S denotes the event that a patient selected at random and survives, event A denotes that a patient selected at random received Treatment A, and B denotes the event that a patient selected at random and received Treatment B.
i.
The probability of any event A is given below:
The total number of randomly selected patient is 600.
The total number of patient selected at random survives is 456.
The probability of a randomly selected patients and who survive is calculated as follows:
Thus, the probability of a randomly selected patients who survive is 0.76.
ii.
Conditional rule:
The formula for probability of E given F is,
The total number of patient selected at random and received Treatment A is 300.
The number of patient selected at random and received Treatment A and survive is 215.
The probability that the selected patients at random received Treatment A, given that the patient selected at random survives. It is calculated as follows:
Thus, the value of
iii.
The total number of patient selected at random and received Treatment B is 300.
The number of patient selected at random that received Treatment B and survive is 241.
The probability that the selected patient at random received Treatment B, given that the patient selected at random survives. It is calculated as follows:
Thus, the value of
iv.
The probability of patient who received Treatment B survived more than that of Treatment A.
Thus, Treatment B is better than Treatment A.
b.
i. Compute
ii. Obtain
iii. Calculate
iv. Find the better treatment.
Answer to Problem 52E
i. The value of
ii. The value of
iii. The value of
iv. Treatment A is better than Treatment B.
Explanation of Solution
Calculation:
The given information is the summary table of the survey.
i.
The total number of randomly selected patient is 240.
The total number of patient selected at random and survives is 140.
The probability of a randomly selected patients who survive is calculated as follows:
Thus, the probability of a randomly selected patients who survive is 0.583.
ii.
Conditional rule:
The formula for probability of E given F is,
The total number of patients selected at random that received Treatment A is 200.
The number of patient selected at random that received Treatment A and survives is 120.
The probability that the selected patient at random received Treatment A, given that the patient selected at random survives. It is calculated as follows:
Thus, the value of
iii.
The total number of patients selected at random that received Treatment B is 40.
The number of patient selected at random that received Treatment B and survive is 20.
The probability that the selected patient at random received Treatment B, given that the patient selected at random survives. It is calculated as follows:
Thus, the value of
iv.
The probability of patient who received Treatment A survived more than that of Treatment B.
Thus, Treatment A is better than Treatment B.
c.
i. Compute
ii. Obtain
iii. Calculate
iv. Find the better treatment.
Answer to Problem 52E
i. The value of
ii. The value of
iii. The value of
iv. Treatment A is better than Treatment B.
Explanation of Solution
Calculation:
The given information is the summary table of the survey.
i.
The total number of randomly selected patient is 360.
The total number of patient selected at random that survive is 316.
The probability of a randomly selected patients who survive is calculated as follows:
Thus, the probability of a randomly selected patients who survive is 0.878.
ii.
Conditional rule:
The formula for probability of E given F is,
The total number of patient selected at random that received Treatment A is 100.
The number of patient selected at random that received Treatment A and survive is 95.
The probability that the selected patients at random received Treatment A, given that the patient selected at random survives. It is calculated as follows:
Thus, the value of
iii.
The total number of patient selected at random that received Treatment B is 260.
The number of patient selected at random that received Treatment B and survive is 221.
The probability that the selected patients at random received Treatment B, given that the patient selected at random survives. It is calculated as follows:
Thus, the value of
iv.
The probability of patients who received Treatment A survived more than that of Treatment B.
Thus, Treatment A is better than Treatment B.
d.
Explain the reason for the existence of apparent inconsistency in the data.
Explanation of Solution
From part (a), (b) and (c), it can be observed that Treatment A performs better than that of Treatment B, except part (a). In part (a), the data for men and women are combined. Thus, Treatment B performs better than that of Treatment A.
Want to see more full solutions like this?
Chapter 6 Solutions
INTRODUCTION TO STATISTICS & DATA ANALYS


- The paper "From Dr. Kildare to Grey's Anatomy"† describes several studies of how the way in which doctors are portrayed on television might influence public perception of doctors. One study was described as follows. Rebecca Chory, Ph.D., now an associate professor of communication at West Virginia University, began studying the effect of such portrayals on patients' attitudes toward physicians. Using a survey of 300 undergraduate students, she compared perceptions of physicians in 1992—the end of the era when physicians were shown as all-knowing, wise father figures—with those in 1999, when shows such as ER and Chicago Hope (1994–2000) were continuing the transformation to showing the private side and lives of physicians, including vivid demonstrations of their weaknesses and insecurities. Dr. Chory found that, regardless of the respondents' personal experience with physicians, those who watched certain kinds of television had declining perceptions of physicians' composure and regard…arrow_forwardLeisure Activities and Dementia. An article appearing in the Los Angeles Times discussed the study “Leisure Activities and the Risk of Dementia in the Elderly” (New England Journal of Medicine, Vol. 348) by J.Verghese et al. The article in the Times, titled “Crosswords Reduce Risk of Dementia,” contained the following statement: “Elderly people who frequently read, do crossword puzzles, practice a musical instrument or play board games cut their risk of Alzheimer’s and other forms of dementia by nearly two-thirds compared with people who seldom do such activities.” Comment on thestatement in quotes, keeping in mind the type of study for which causation can be reasonably inferred.arrow_forwardCHI SQUARE QUESTION Research has demonstrated strong gender differences in teenagers’ approaches to dealing with mental health issues (Chandra & Minkovitz, 2006). In a typical study, eighth-grade students are asked to report their willingness to use mental health services in the event they were experiencing emotional or other mental health problems. Typical data for a sample of n = 150 students are shown in Table 17.8. Do the data show a significant relationship between gender and willingness to seek mental health assistance? Note: This is an example for a Chi-Square Test for Independence. Probably No Maybe Probably Yes Males 17 32 11 60 Females 13 43 34 90 30 75 45 n = 150 Demonstrate the 4 steps of hypothesis testing, with an alpha level of .05. In addition, provide a table with expected frequencies. The expected frequencies must maintain the same row totals and column totals, and create an ideal frequency…arrow_forward
- Are nursing salaries in Tampa, Florida, lower than those in Dallas, Texas? Salary data show staff nurses in Tampa earn less than staff nurses in Dallas (The Tampa Tribune, January 15, 2007). Suppose that in a follow-up study of 40 staff nurses in Tampa and 50 staff nurses in Dallas you obtain the following results. Tampa n1 = 40 X1 = $56,100 S1 = $6000 Dallas n2 = 50 X2 = $59,400 S2 = $7000 Complete the confidence interval of the data setarrow_forward12. McAllister et al. (2012) compared varsity football and hockey players with varsity athletes from noncontact sports to determine whether exposure to head impacts during one season have an effect on cognitive perfor- mance. In the study, tests of new learning performance were significantly poorer for the contact sport athletes compared to the noncontact sport athletes. The follow- ing table presents data similar to the results obtained in the study. Noncontact Athletes Contact Athletes 10 7 8 4 7 9. 9 3 13 7 7 10 12 2 a. Are the test scores significantly lower for the con- tact sport athletes than for the noncontact athletes? Use a one-tailed test with a = .05. b. Compute the value of r (percentage of variance accounted for) for these data.arrow_forwardVideo Games. A pathological video game user (PVGU) is a video game user that averages 31 or more hours a week of gameplay. According to the article “Pathological Video Game Use among Youths: A Two-Year Longitudinal Study” (Pediatrics, Vol. 127, No. 2, pp. 319–329) by D. Gentile et al., in 2011, about 9% of children in grades 3–8 were PVGUs. Suppose that, today, seven youths in grades 3–8 are randomly selected. a. Assuming that the percentage of PVGUs in grades 3–8 is the same today as it was in 2011, determine the probability distribution for the number, X, who are PVGUs. b. Determine and interpret the mean of X. c. If, in fact, exactly three of the seven youths selected are PVGUs, would you be inclined to conclude that the percentage of PVGUs in grades 3–8 has increased from the 2011 percentage? Explain your reasoning. Hint: First consider the probability P(X ≥ 3). d. If, in fact, exactly two of the seven youths selected are PVGUs, would you be inclined to conclude that the percentage…arrow_forward
- “This paper reports the prevalence of obesity in the US based on World Health Organization’s (WHO) classification of obesity. It also reports the prevalence of individuals in the general population who use dietary modifications and/or exercise to lose weight. The main objective of this paper is to assess the relationship between obesity status, HRQL, dietary modifications, and exercise…Responses to the HRQL questions were used as dependent variables…by dichotomizing the number of reported days with poor physical health…into ≤ 14 days and > 14 days.” (Hassan et al., 2003, pp. 1227-1228) The odds ratios that result from the logistic regression defined in part (a) are: Nonoverweight: Reference Overweight: 1.08 (0.99-1.17) Obese: 1.21 (1.09-1.33) Severely Obese: 1.87 (1.64-2.12) Provide a conclusion. Be sure to include a discussion of statistical inference.arrow_forward(2) The researcher wants to associate teaching philosophies of teachers to leadership styles of their respective school head (Ho: There is no significant relationship between teacher's teaching philosophy and school head's leadership style.) Below is the data: Teaching Philosophy Essentialism Progressivism Democratic Authoritative Transformational Transactional Laissez- Faire 27 23 50 65 66 131 54 28 82 Level of significance: 5% Degree of Freedom: Critical value: 9.488 Calculated Critical Value: Hypothesis: Interpretation: There is Leadership Style -Σ x² = 100 250 350 Test for the significant relationship of the two variables in 5% level of significance. The critical value is already given below. 320 475 795 (0 - E)² E Total significant relationship between the two variables. 566 842 1408arrow_forwardProduct placement is a form of advertising in which a company's products and name are intentionally positioned in motion pictures, TV programs, radio broadcasting, and the likes. Product placement can take many forms: verbal mentions in dialogue, actual use by a character, or visual displays. a. Describe the dependent and independent variables for a proposed study from this scenario. b. Describe hypotheses that your study will test based on the scenario above. Product placement is a form of advertising in which a company's products and name are intentionally positioned in motion pictures, TV programs, radio broadcasting and the likes. Product placement can take many forms: verbal mentions in dialogue, actual use by a character, or visual displays. [Max. 300 words] a. Describe the dependent and independent variables for a proposed study from this scenario. b. Describe hypotheses that your study will test based on the scenario above.arrow_forward
- When two independent variables produce effects when combined that would not be present if each independent variables was manipulated in a separate study, we say that there is O no main effect. O only a measured variable an interaction. O a planned comparison. rist and Stangor (2001) studied prejudice and found that you can't predict a person's behavior toward minorities on the basis of whether they are high or lowarrow_forwardA clinical researcher would like to know whether a certain drug is more effective at treating lepression than just psychotherapy alone. In order to study this topic, the researcher gains access to a population of individuals diagnosed with depression and administers surveys to a random subset of that population. To assess the relationship between therapy type and depression symptoms, the survey asks participants what their current treatment plan involves (drug therapy, psychotherapy, both drug and psychotherapy, or no therapy) and what their current depression symptoms include. This study is a(n): observational study randomized comparative experiment stratified random sample block designarrow_forward
 Glencoe Algebra 1, Student Edition, 9780079039897...AlgebraISBN:9780079039897Author:CarterPublisher:McGraw Hill
 Big Ideas Math A Bridge To Success Algebra 1: Stu...AlgebraISBN:9781680331141Author:HOUGHTON MIFFLIN HARCOURTPublisher:Houghton Mifflin Harcourt
 Holt Mcdougal Larson Pre-algebra: Student Edition...AlgebraISBN:9780547587776Author:HOLT MCDOUGALPublisher:HOLT MCDOUGAL