
Concept explainers
Videos
To find: The best fit curve of the data.
Answer to Problem 2E
Explanation of Solution
Given: The table shows number minutes out of 8 hours work day.
In table shows number of minutes out of each eight- hour work day for various years.
Let t =30 represents year corresponding to 1930 .
Now plot the
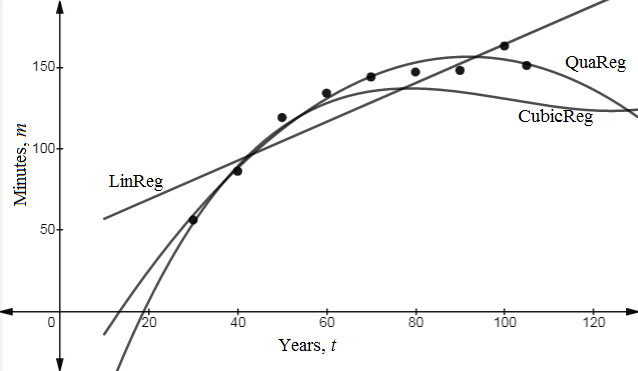
Using graph the equation of regression,
Linear regression,
Quadratic regression,
Cubic regression,
So, coefficient of regression constant is nearest to 1 for cubic regression. Best fit curve would be cubic.
Hence, the best fit curve for the given data is cubic,
Chapter 6 Solutions
Algebra 2
Additional Math Textbook Solutions
Linear Algebra and Its Applications (5th Edition)
College Algebra
Elementary Algebra
College Algebra (7th Edition)


 Algebra and Trigonometry (6th Edition)AlgebraISBN:9780134463216Author:Robert F. BlitzerPublisher:PEARSON
 Contemporary Abstract AlgebraAlgebraISBN:9781305657960Author:Joseph GallianPublisher:Cengage Learning
 Linear Algebra: A Modern IntroductionAlgebraISBN:9781285463247Author:David PoolePublisher:Cengage Learning
 Algebra And Trigonometry (11th Edition)AlgebraISBN:9780135163078Author:Michael SullivanPublisher:PEARSON
 Introduction to Linear Algebra, Fifth EditionAlgebraISBN:9780980232776Author:Gilbert StrangPublisher:Wellesley-Cambridge Press
 College Algebra (Collegiate Math)AlgebraISBN:9780077836344Author:Julie Miller, Donna GerkenPublisher:McGraw-Hill Education