
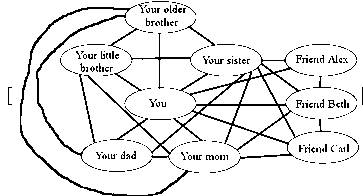
Up close and personal. Create a graph to model your friendship connections with a few (up to six or eight) of your friends. You and your friends are the vertices, with an edge between any two who are friends.
To sketch: a graph to model your friendship connections with a few of your friends.
Explanation of Solution
Your graph will vary, of course, but suppose you have two parents, three sibling, and three close friends. Also, suppose your mom knows only two of those friends, but your sister knows all three. Then your graph would look something like the one below.
Want to see more full solutions like this?
Chapter 6 Solutions
The Heart of Mathematics: An Invitation to Effective Thinking
Additional Math Textbook Solutions
Elementary Statistics (13th Edition)
Calculus: Early Transcendentals (2nd Edition)
Elementary Statistics: Picturing the World (7th Edition)
Introductory Statistics
University Calculus: Early Transcendentals (4th Edition)
Basic Business Statistics, Student Value Edition
- 2 D Question 3 D For the right triangle below, find the measure of the angle marked with question mark. Figure is not to scale. Upload Choose a File Question 4 <--? 11 Solve for t, 0arrow_forward6.4. The data shown in Table 6E.1 are x and R values for 24 samples of size n = 5 taken from a process producing bearings. The measurements are made on the inside diameter of the bearing, with only the last three decimals recorded (i.e., 34.5 should be 0.50345). Table 6E.1 Bearing Diameter Data Sample Number Sample x R Number 7 R 1 34.5 3 13 35.4 2 34.2 4 14 34.0 88 6 3 31.6 4 15 37.1 4 31.5 4 16 34.9 5 35.0 5 17 33.5 6 34.1 6 18 31.7 7 32.6 4 19 34.0 8 33.8 3 20 35.1 9 34.8 7 21 33.7 10 33.6 8 22 32.8 11 12 12 31.9 3 23 33.5 38.6 9 24 34.2 5743 842-33 1 a. Set up x and R charts on this process. Does the process seem to be in statistical control? If necessary, revise the trial control limits. Draw x-bar control chart and R chart X₁ + x2 + ……. +xm x = ; m UCL× = X + A₂Ŕ CLx = x LCL = X — A₂Ŕ UCLR = DÅR CLR = R LCLR = D3R R R₁ + R₂ + ··· + Rm ... m Remove the data that are not in control and recalculate UCL, CL, LCL and redraw control chart. b. If specifications on this diameter are…arrow_forwardAn automobile manufacturer wishes to monitor the number of nonconformities in a subassembly area producing manual transmissions. The inspection unit is defined as four transmissions, and data from 16 samples (each of size 4) are shown in Table 7E.11. a. Set up a control chart for nonconformities per unit. A u chart of average number of nonconformities per unit is appropriate, with n = 4 transmissions in each inspection. b. Do these data come from a controlled process? If not, assume that assignable causes can be found for all out-of-control points and calculate the revised control chart parameters. Draw x-bar control chart and R chart c. Suppose the inspection unit is redefined as eight transmissions. Design an appropriate control chart for monitoring future productionarrow_forwardThe data in Table 7E.3 give the number of nonconforming bearing and seal assemblies in samples of size 100. Construct a fraction nonconforming control chart for these data. If any points plot out of control, assume that assignable causes can be found and determine the revised control limits. n=100;" " m=20;" " ∑_(i=1)^m▒D_i =117;" " p ̄=(∑_(i=1)^m▒D_i )/mn "UC" "L" _p=p ̄+3√((p ̄(1-p ̄))/n) "LC" "L" _p=p ̄-3√((p ̄(1-p ̄))/n) Draw x-bar control chart and R chart Remove the data that are not in control and recalculate UCL, CL, LCL and redraw control chart.arrow_forwardWrite the quadratic function in the form f (x) = a(x − h)² + k. 6 5 4 3 2 1 -8 -7 -6 -5 -4 -3 -2 -1 -1 -2 -3 -4 -5 -6 -7 f(x) = -8+ 1 2 3 4 5 6 7 8arrow_forwardDO NOT WANT AI SOLUTION. Thank Youarrow_forward4. )Consider R5 with dot product and Euclidean norm, a subspace U, and a vector x defined below. Compute the orthogonal projection II, (x) of x onto U, and the distance d(x, U) from x onto U. Include necessary tableau work for linear independence and/or solving system(s) of linear equations. 4 9 2 1 1 -1 U = span[u₁ = 0 , նշ :— 1 , U3 = 3|], x = = 1 0 1 2 -4 2 2 See practice exam 1 #7arrow_forwardsample size: 40 mean: 6.5 standra dev: 2.8232 hypothsized mean: 5.9 test stast: 1.41 degree of freedom: 39arrow_forward5. Submit answer Practice similar X Compute T2(x) at x = 0.6 for y = e and use a calculator to compute the error le-T2(x)| at x = 0.2. T2(x) \e - T₂(x) = Submit answer Answers Answer II 0 @ T E R 5 do The Weather Channel DELL F7 FB D F G H UP Score 8 B N Marrow_forwardProblem 2. Let T be a given linear transformation. 1. Explain in detail why every non-zero scalar multiple of an eigenvector of T is also an eigenvector of T. 2. Show that every non-zero linear combination of two eigenvectors v, w corresponding to the same eigenvalue is also an eigenvector. 3. Prove that a linear combination cv + dw (with c, d 0) of two eigenvectors corresponding to different eigenvalues is never an eigenvector.arrow_forward8. A large online retailer is analyzing how frequently their product WonderWidget" is returned. Out of 345 WonderWidgets bought, 48 were returned. (a) Find the 97% confidence interval for the long-run proportion of Wonder Widgets returned. (b) If the retailer wanted to obtain a 97% confidence interval with a margin of error ±0.03, how many purchases it should analyze?arrow_forward7. Researchers are studying the pain-killing effects of a new drug excedrol. They administered the drug to a test sample and a placebo to a control sample. People reported the improvement in their symptoms on a scale of 1 to 5. The results are st.dev. n mean Excedrol Placebo 50 3.35 50 2.12 1.24 1.80 At the level of 1%, test the hypothesis that excedrol performs better than placebo.arrow_forwardarrow_back_iosSEE MORE QUESTIONSarrow_forward_ios
- Glencoe Algebra 1, Student Edition, 9780079039897...AlgebraISBN:9780079039897Author:CarterPublisher:McGraw HillHolt Mcdougal Larson Pre-algebra: Student Edition...AlgebraISBN:9780547587776Author:HOLT MCDOUGALPublisher:HOLT MCDOUGALAlgebra & Trigonometry with Analytic GeometryAlgebraISBN:9781133382119Author:SwokowskiPublisher:Cengage
- Big Ideas Math A Bridge To Success Algebra 1: Stu...AlgebraISBN:9781680331141Author:HOUGHTON MIFFLIN HARCOURTPublisher:Houghton Mifflin HarcourtAlgebra: Structure And Method, Book 1AlgebraISBN:9780395977224Author:Richard G. Brown, Mary P. Dolciani, Robert H. Sorgenfrey, William L. ColePublisher:McDougal LittellTrigonometry (MindTap Course List)TrigonometryISBN:9781337278461Author:Ron LarsonPublisher:Cengage Learning