
Statistical Reasoning for Everyday Life Plus MyLab Statistics with Pearson eText -- 18 Week Access Card Package (5th Edition)
5th Edition
ISBN: 9780135990278
Author: Bennett, Jeffrey O., Briggs, William L., Triola, Mario F.
Publisher: PEARSON
expand_more
expand_more
format_list_bulleted
Concept explainers
Videos
Textbook Question
Chapter 6.4, Problem 10E
Commercial Aviation. For Exercises 9–12, use the following table, which summarizes some data on commercial aviation flights in the United States for three separate years.
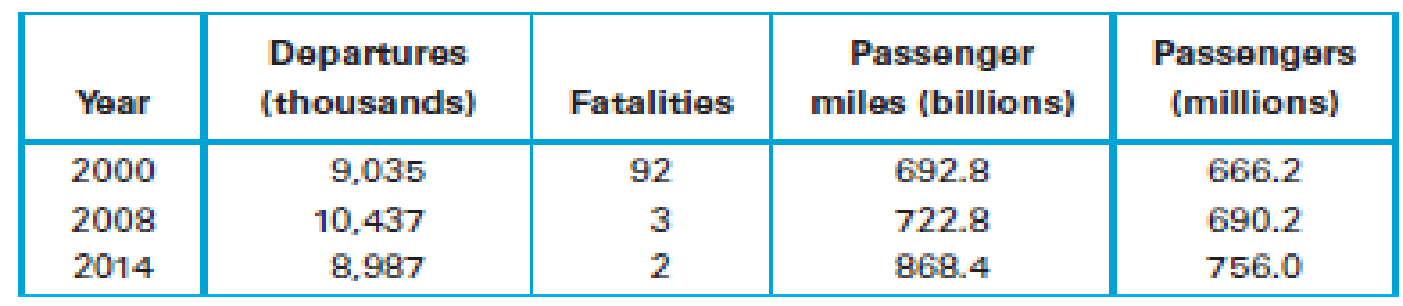
- 10. For each of the three years, find the fatality rate in deaths per billion passenger miles. On the basis of those rates, which year was the safest? Why?
Expert Solution & Answer
Want to see the full answer?
Check out a sample textbook solution
Students have asked these similar questions
Using the data in Table 6–11, calculate a 3-month moving average forecast for month 12.
Table 3.5 provides the number of deaths from all causes and from accidents (unintentional injuries) by age group in the United States in 2002. Review the following rates. Determine what to call each one, then calculate it using the data provided in Table.
1. Unintentional-injury-specific mortality rate for the entire population. Calculate cause-specific mortality rate.
2. All-cause mortality rate for 25–34 years old. Calculate the age-specific mortality rate.
3. All-cause mortality among males. Calculate the sex-specific mortality rate.
4.Unintentional-injury specific mortality among 25 to 34 years old males. Calculate the is a cause-specific, age-specific, and sex-specific mortality rate
A neighborhood is trying to set up school carpools, but they need to determine the number of students who need to travel to the elementary school (ages 5–10), the middle school (ages 11–13), and the high school (ages 14–18). A histogram summarizes their findings:
Histogram titled Carpool, with Number of Children on the y axis and Age Groups on the x axis. Bar 1 is 5 to 10 years old and has a value of 3. Bar 2 is 11 to 13 years old and has a value of 7. Bar 3 is 14 to 18 years old and has a value of 4.
Which of the following data sets is represented in the histogram?
A. {3, 3, 3, 7, 7, 7, 7, 7, 7, 7, 4, 4, 4, 4}
B. {5, 10, 4, 11, 12, 13, 12, 13, 12, 11, 14, 14, 19, 18}
C. {5, 6, 5, 11, 12, 13, 12, 13, 14, 15, 11, 18, 17, 13}
D. {3, 5, 10, 11, 13, 7, 18, 14, 4}
Chapter 6 Solutions
Statistical Reasoning for Everyday Life Plus MyLab Statistics with Pearson eText -- 18 Week Access Card Package (5th Edition)
Ch. 6.1 - Coin Tossing. Suppose you toss a coin 100 times....Ch. 6.1 - Statistical Significance. What do we mean when we...Ch. 6.1 - Prob. 3ECh. 6.1 - Quantifying Significance. What does it mean to say...Ch. 6.1 - Does It Make Sense? For Exercises 58, determine...Ch. 6.1 - Does It Make Sense? For Exercises 58, determine...Ch. 6.1 - Does It Make Sense? For Exercises 58, determine...Ch. 6.1 - Does It Make Sense? For Exercises 58, determine...Ch. 6.1 - Subjective Significance. For each event in...Ch. 6.1 - Subjective Significance. For each event in...
Ch. 6.1 - Subjective Significance. For each event in...Ch. 6.1 - Subjective Significance. For each event in...Ch. 6.1 - Subjective Significance. For each event in...Ch. 6.1 - Subjective Significance. For each event in...Ch. 6.1 - Subjective Significance. For each event in...Ch. 6.1 - Subjective Significance. For each event in...Ch. 6.1 - Prob. 17ECh. 6.1 - Carpal Tunnel Syndrome Treatments. An experiment...Ch. 6.1 - Prob. 19ECh. 6.1 - Prob. 20ECh. 6.1 - Human Body Temperature. In a study by researchers...Ch. 6.1 - Seat Belts and Children. In a study of children...Ch. 6.1 - Prob. 23ECh. 6.1 - Subjective Significance. For each event in...Ch. 6.2 - Outcomes and Events. Distinguish between an...Ch. 6.2 - Notation. What does it mean when we write P(A)?...Ch. 6.2 - Probability Types. Briefly describe the...Ch. 6.2 - Prob. 4ECh. 6.2 - Prob. 5ECh. 6.2 - Does It Make Sense? For Exercises 58, determine...Ch. 6.2 - Prob. 7ECh. 6.2 - Does It Make Sense? For Exercises 58, determine...Ch. 6.2 - Counting Outcomes. How many different three-child...Ch. 6.2 - Prob. 10ECh. 6.2 - Theoretical Probabilities. For Exercises 1120, use...Ch. 6.2 - Theoretical Probabilities. For Exercises 1120, use...Ch. 6.2 - Theoretical Probabilities. For Exercises 1120, use...Ch. 6.2 - Theoretical Probabilities. For Exercises 1120, use...Ch. 6.2 - Theoretical Probabilities. For Exercises 1120, use...Ch. 6.2 - Theoretical Probabilities. For Exercises 1120, use...Ch. 6.2 - Theoretical Probabilities. For Exercises 1120, use...Ch. 6.2 - Theoretical Probabilities. For Exercises 1120, use...Ch. 6.2 - Theoretical Probabilities. For Exercises 1120, use...Ch. 6.2 - Theoretical Probabilities. For Exercises 1120, use...Ch. 6.2 - Days of the Week. What is the probability of...Ch. 6.2 - Days of the Week. What is the probability of...Ch. 6.2 - Complementary Events. Exercises 2330 involve...Ch. 6.2 - Complementary Events. Exercises 2330 involve...Ch. 6.2 - Complementary Events. Exercises 2330 involve...Ch. 6.2 - Complementary Events. Exercises 2330 involve...Ch. 6.2 - Complementary Events. Exercises 2330 involve...Ch. 6.2 - Complementary Events. Exercises 2330 involve...Ch. 6.2 - Prob. 29ECh. 6.2 - Prob. 30ECh. 6.2 - Theoretical Probabilities. For Exercises 3134, use...Ch. 6.2 - Theoretical Probabilities. For Exercises 3134, use...Ch. 6.2 - Theoretical Probabilities. For Exercises 3134, use...Ch. 6.2 - Theoretical Probabilities. For Exercises 3134, use...Ch. 6.2 - Relative Frequency Probabilities. Use the relative...Ch. 6.2 - Relative Frequency Probabilities. Use the relative...Ch. 6.2 - Relative Frequency Probabilities. Use the relative...Ch. 6.2 - Prob. 38ECh. 6.2 - Probability Distributions. In Exercises 39 and 40,...Ch. 6.2 - Probability Distributions. In Exercises 39 and 40,...Ch. 6.3 - Law of Large Numbers. What is the law of large...Ch. 6.3 - Understanding the Law of Large Numbers. In terms...Ch. 6.3 - Expected Value. What is an expected value, and how...Ch. 6.3 - Gamblers Fallacy. What is the gamblers fallacy?...Ch. 6.3 - Prob. 5ECh. 6.3 - Does It Make Sense? For Exercises 58, determine...Ch. 6.3 - Prob. 7ECh. 6.3 - Does It Make Sense? For Exercises 58, determine...Ch. 6.3 - Gender Selection. In analyzing genders of...Ch. 6.3 - Speedy Driver. A person who has a habit of driving...Ch. 6.3 - Should You Play? Suppose you are offered this...Ch. 6.3 - Kentuckys Pick 4 Lottery. If you bet 1 in...Ch. 6.3 - Expected Value for Life Insurance. There is a...Ch. 6.3 - Expected Value for Life Insurance There is a...Ch. 6.3 - Expected Waiting Time. You arrive at a bus stop...Ch. 6.3 - Expected Value in Roulette. As shown in Figure...Ch. 6.3 - Expected Value in Casino Dice. When you give a...Ch. 6.3 - New Jersey Pick 4. In New Jerseys Pick 4 lottery,...Ch. 6.3 - Extra Points in Football. Football teams have the...Ch. 6.3 - Prob. 20ECh. 6.3 - Psychology of Expected Values. In 1953, a French...Ch. 6.3 - Behind in Coin Tossing: Can You Catch Up? Suppose...Ch. 6.4 - Risk and Travel. What is travel risk? Give an...Ch. 6.4 - Prob. 2ECh. 6.4 - Prob. 3ECh. 6.4 - Prob. 4ECh. 6.4 - Prob. 5ECh. 6.4 - Does It Make Sense? For Exercises 58, determine...Ch. 6.4 - Prob. 7ECh. 6.4 - Prob. 8ECh. 6.4 - Prob. 9ECh. 6.4 - Commercial Aviation. For Exercises 912, use the...Ch. 6.4 - Commercial Aviation. For Exercises 912, use the...Ch. 6.4 - Prob. 12ECh. 6.4 - Births/Deaths. For Exercises 1316, use the data in...Ch. 6.4 - Births/Deaths. For Exercises 1316, use the data in...Ch. 6.4 - Births/Deaths. For Exercises 1316, use the data in...Ch. 6.4 - Births/Deaths. For Exercises 1316, use the data in...Ch. 6.4 - Vital Statistics. For Exercises 1720, use the data...Ch. 6.4 - Vital Statistics. For Exercises 1720, use the data...Ch. 6.4 - Prob. 19ECh. 6.4 - Prob. 20ECh. 6.4 - Prob. 21ECh. 6.4 - Prob. 22ECh. 6.4 - Prob. 23ECh. 6.4 - Prob. 24ECh. 6.4 - Prob. 25ECh. 6.4 - Prob. 26ECh. 6.4 - Prob. 27ECh. 6.4 - Prob. 28ECh. 6.4 - Life in This Century. Example 5 assumed that the...Ch. 6.4 - Prob. 30ECh. 6.5 - Independence. Let A denote the event of getting a...Ch. 6.5 - Independence. A geneticist is working with 3 green...Ch. 6.5 - Prob. 3ECh. 6.5 - Complementary Events. Let A be the event of...Ch. 6.5 - Prob. 5ECh. 6.5 - Does It Make Sense? For Exercises 58, determine...Ch. 6.5 - Does It Make Sense? For Exercises 58, determine...Ch. 6.5 - Does It Make Sense? For Exercises 58, determine...Ch. 6.5 - Births. Assume that boys and girls are equally...Ch. 6.5 - Births. A couple plans to have four children. Find...Ch. 6.5 - Password. A programmer is instructed to create a...Ch. 6.5 - Wearing Hunter Orange. A study of hunting injuries...Ch. 6.5 - Songs. The 50 songs on a smartphone consist of 15...Ch. 6.5 - Polls. A pollster plans to call adults. She has a...Ch. 6.5 - Probability and Court Decisions. In Exercises...Ch. 6.5 - Probability and Court Decisions. In Exercises...Ch. 6.5 - Probability and Court Decisions. In Exercises...Ch. 6.5 - Probability and Court Decisions. In Exercises...Ch. 6.5 - Probability and Court Decisions. In Exercises...Ch. 6.5 - Probability and Court Decisions. In Exercises...Ch. 6.5 - Prob. 21ECh. 6.5 - Pedestrian Deaths. For Exercises 2126, use the...Ch. 6.5 - Prob. 23ECh. 6.5 - Pedestrian Deaths. For Exercises 2126, use the...Ch. 6.5 - Prob. 25ECh. 6.5 - Pedestrian Deaths. For Exercises 2126, use the...Ch. 6.5 - Clinical Trial. In a clinical trial of an allergy...Ch. 6.5 - Prob. 28ECh. 6.5 - Prob. 29ECh. 6.5 - Survey Refusals. Refer to the data in Exercise 29....Ch. 6.5 - Drug Testing. A 1-Panel-THC test for marijuana use...Ch. 6.5 - BINGO. The game of BINGO involves drawing numbered...Ch. 6 - For Exercises 17, use the data in the following...Ch. 6 - For Exercises 17, use the data in the following...Ch. 6 - For Exercises 17, use the data in the following...Ch. 6 - For Exercises 17, use the data in the following...Ch. 6 - For Exercises 17, use the data in the following...Ch. 6 - For Exercises 17, use the data in the following...Ch. 6 - For Exercises 17, use the data in the following...Ch. 6 - The Binary Computer Company manufactures computer...Ch. 6 - For a recent year, the fatality rate from motor...Ch. 6 - A Las Vegas handicapper can correctly predict the...Ch. 6 - For the handicapper in Exercise 1, find the...Ch. 6 - In a clinical trial of the effectiveness of a...Ch. 6 - If P(A) = 0.65, what is the value of P(not A)?Ch. 6 - In Exercises 610, use the following results. The...Ch. 6 - In Exercises 610, use the following results. The...Ch. 6 - Prob. 8CQCh. 6 - In Exercises 610, use the following results. The...Ch. 6 - In Exercises 610, use the following results. The...
Knowledge Booster


Learn more about
Need a deep-dive on the concept behind this application? Look no further. Learn more about this topic, statistics and related others by exploring similar questions and additional content below.Similar questions
- Solve #4 onlyarrow_forwardSolve task from imagearrow_forwardAn observational study is conducted to compare experiences of men and women between the ages of 50‒59 years, following coronary artery bypass surgery. Participants undergo the surgery and are followed until the time of death, until they are lost to follow-up, or up to 30 years, whichever comes first. The following table details the experiences of participating men and women. The data below are years of death or years of last contact for men and women. Men Women Year of Death Year of Last Contact Year of Death Year of Last Contact 5 8 19 4 12 17 20 9 14 24 21 14 23 26 24 15 29 26 17 27 19 29 21 30 22 30 24 30 25 30 a) Estimate the survival functions for each treatment group using the Kaplan-Meier approach. b) Test whether there is a significant difference in survival between treatment groups using the log rank test and a 5 percent…arrow_forward
- The table below shows the share of income going to each quintile of the income distribution for Neverland in 1980 and 1990. Complete the table below finding the the cumulative share of income for 1980 and 1990 and answer the following: Share of income in Cumulative share of Share of income in Cumulative share of Quintiles 1980 income in 1980 1990 income in 1990 1st 7% 6.6.% 2nd 11.5% 11.5% 3rd 17% 16.3% 4th 24.8% 22.7% 5th 39.7% 42.9% a) Sketch the Perfect Equality line and the Lorenz curve for 1980 and for 1990. Don't forget to label your graph and your curves! b) According to the Lorenz curves that you draw in (a), which year had worse income inequality, 1980 or 1990? JUSTIFY your answer! NOTE: This is a file upload question. Work your answer in a piece of paper, take a picture and upload your file.arrow_forwardThe table below shows the number of state-registered automatic weapons and the murder rate for several Northwestern states. 11.5 8.6 6.9 3.4 2.3 2.7 2.4 0.5 14 11.3 9.7 6.9 6.1 6.5 5.9 4.8 thousands of automatic weapons = murders per 100,000 residents 0.84x + 4.13. Use this equation to answer the following; This data can be modeled by the equation y Special Note: I suggest you verify this equation by performing linear regression on your calculator. A) How many murders per 100,000 residents can be expected in a state with 1.1 thousand automatic weapons? Answer = Round to 3 decimal places. B) How many murders per 100,000 residents can be expected in a state with 7.1 thousand automatic weapons? Answer Round to 3 decimal places. %3Darrow_forwardA sociologist studying the justice system has just written a paper detailing her findings after examining the records of thousands of inmates. Among other things, she looked at the time spent in prison by inmates who had been sentenced to 5– 10 years for a felony conviction. The histogram below, which appears in her paper, summarizes the time spent in prison for each of 50 such inmates. Frequency 20 20- 15 15- 10- 5 5 5 5+ 0- 20 60 Time spent in prison (in months) 40 80 100 120 Based on this histogram, estimate the standard deviation of the sample of 50 prison terms. Carry your intermediate computations to at least four decimal places, and round your answer to at least one decimal place. (If necessary, consult a list of formulas.)arrow_forward
- O.R data preparation is a trivial step, due to the time required and the possibility of data collection errors. True of fallsarrow_forwardYou have the following data: Gasoline Sales during 2017.1 to 2020.4 (in 000 of barrels) Year and quarter Gasoline Sales Year and quarter Gasoline sales 2017.1 22434 2019.1 22776 2017.2 23766 2019.2 24491 2017.3 23860 2019.3 24751 2017.4 23391 2019.4 24170 2018.1 22662 2020.1 23302 2018.2 24032 2020.2 24045 2018.3 24171 2020.3 25437 2018.4 23803 2020.4 25272 (A)Using data on gasoline sales (in thousands of barrels) from the first quarter of 2017 to the last quarter of 2020, estimate the secular linear trend equation. (B) Accordingly, forecast gasoline sales for the four quarters of 2021. (C)Use the dummy variables methods to adjust the trend forecasts for the four quarters of 2021 you made in (B) above to take the seasonal variations into account.arrow_forwardAnswer 1 2 3 4arrow_forward
- The table shows the number of accidents, fatalities, hours and miles flew for U.S. airlines. Year Accidents Fatalities Hours flown Miles flown 2000 59 98 16.7 million 7.1 billions 2005 36 28 18.7 7.8 2010 29 0 17.2 7.3 2015 25 0 17.4 7.6 a. Compute the accident rate per million hours flown in 2000 and 2015. By this measure, has travel on U.S. airlines become safer? b. Compute the accident rate per billion miles flown in 2000 and 2015. By this measure, has travel on U.S. airlines become safer?arrow_forwardYou may need to use the appropriate technology to answer this question. A travel association reported the domestic airfare (in dollars) for business travel for the current year and the previous year. Below is a sample of 12 flights with their domestic airfares shown for both years. CurrentYear PreviousYear 345 315 526 475 420 474 216 206 285 263 405 432 635 585 710 650 605 545 517 547 570 496 610 580 (a) Formulate the hypotheses and test for a significant increase in the mean domestic airfare for business travel for the one-year period. H0: μd ≥ 0 Ha: μd < 0 H0: μd ≤ 0 Ha: μd > 0 H0: μd ≠ 0 Ha: μd = 0 H0: μd < 0 Ha: μd = 0 H0: μd = 0 Ha: μd ≠ 0 Calculate the test statistic. (Use current year airfare − previous year airfare. Round your answer to three decimal places.) Calculate the p-value. (Round your answer to four decimal places.) p-value = Using a 0.05 level of significance, what is your conclusion? Reject H0. We can conclude…arrow_forwardYou may need to use the appropriate technology to answer this question. A travel association reported the domestic airfare (in dollars) for business travel for the current year and the previous year. Below is a sample of 12 flights with their domestic airfares shown for both years. CurrentYear PreviousYear 345 315 526 451 420 474 216 206 285 263 405 432 635 585 710 650 605 545 517 547 570 496 610 580 (a) Formulate the hypotheses and test for a significant increase in the mean domestic airfare for business travel for the one-year period. H0: μd = 0 Ha: μd ≠ 0 H0: μd < 0 Ha: μd = 0 H0: μd ≠ 0 Ha: μd = 0 H0: μd ≤ 0 Ha: μd > 0 H0: μd ≥ 0 Ha: μd < 0 Calculate the test statistic. (Use current year airfare − previous year airfare. Round your answer to three decimal places.) 2 Calculate the p-value. (Round your answer to four decimal places.) p-value = 3 Using a 0.05 level of significance, what is your conclusion? Do not reject H0. We cannot…arrow_forward
arrow_back_ios
SEE MORE QUESTIONS
arrow_forward_ios
Recommended textbooks for you
 MATLAB: An Introduction with ApplicationsStatisticsISBN:9781119256830Author:Amos GilatPublisher:John Wiley & Sons Inc
 Probability and Statistics for Engineering and th...StatisticsISBN:9781305251809Author:Jay L. DevorePublisher:Cengage Learning
 Statistics for The Behavioral Sciences (MindTap C...StatisticsISBN:9781305504912Author:Frederick J Gravetter, Larry B. WallnauPublisher:Cengage Learning
 Elementary Statistics: Picturing the World (7th E...StatisticsISBN:9780134683416Author:Ron Larson, Betsy FarberPublisher:PEARSON
 The Basic Practice of StatisticsStatisticsISBN:9781319042578Author:David S. Moore, William I. Notz, Michael A. FlignerPublisher:W. H. Freeman
 Introduction to the Practice of StatisticsStatisticsISBN:9781319013387Author:David S. Moore, George P. McCabe, Bruce A. CraigPublisher:W. H. Freeman
MATLAB: An Introduction with Applications
Statistics
ISBN:9781119256830
Author:Amos Gilat
Publisher:John Wiley & Sons Inc
Probability and Statistics for Engineering and th...
Statistics
ISBN:9781305251809
Author:Jay L. Devore
Publisher:Cengage Learning
Statistics for The Behavioral Sciences (MindTap C...
Statistics
ISBN:9781305504912
Author:Frederick J Gravetter, Larry B. Wallnau
Publisher:Cengage Learning
Elementary Statistics: Picturing the World (7th E...
Statistics
ISBN:9780134683416
Author:Ron Larson, Betsy Farber
Publisher:PEARSON
The Basic Practice of Statistics
Statistics
ISBN:9781319042578
Author:David S. Moore, William I. Notz, Michael A. Fligner
Publisher:W. H. Freeman
Introduction to the Practice of Statistics
Statistics
ISBN:9781319013387
Author:David S. Moore, George P. McCabe, Bruce A. Craig
Publisher:W. H. Freeman
Use of ALGEBRA in REAL LIFE; Author: Fast and Easy Maths !;https://www.youtube.com/watch?v=9_PbWFpvkDc;License: Standard YouTube License, CC-BY
Compound Interest Formula Explained, Investment, Monthly & Continuously, Word Problems, Algebra; Author: The Organic Chemistry Tutor;https://www.youtube.com/watch?v=P182Abv3fOk;License: Standard YouTube License, CC-BY
Applications of Algebra (Digit, Age, Work, Clock, Mixture and Rate Problems); Author: EngineerProf PH;https://www.youtube.com/watch?v=Y8aJ_wYCS2g;License: Standard YouTube License, CC-BY