
Concept explainers
Videos
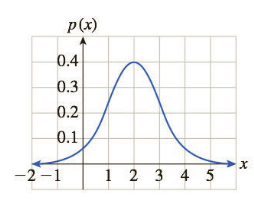
The Normal Curve The
) is shown in the figure. Exercises 71 and 72 illustrate its use.
Consumer Satisfaction In a survey, consumers were asked to rate a new toothpaste on a scale of 1-10. The resulting data are modeled by a normal distribution with
a. Use a Riemann sum with
b. What percentage of customers rated the toothpaste 0 or 1? (Use the range – 0.5 to 1.5.)

Trending nowThis is a popular solution!

Chapter 6 Solutions
Applied Calculus


 Calculus For The Life SciencesCalculusISBN:9780321964038Author:GREENWELL, Raymond N., RITCHEY, Nathan P., Lial, Margaret L.Publisher:Pearson Addison Wesley,