
Videos
The graph of the function
Answer to Problem 43E
The value get varies from
Explanation of Solution
Given information:
Compare the function as given below,
Over the interval as shown below,
Formula used:
Dividing the value of g(x) by 2.5 for every 1 unit decrease in x.
Calculation:
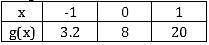
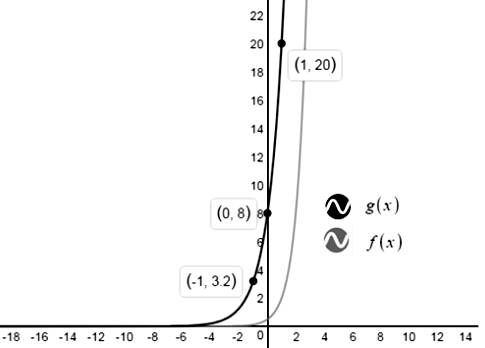
You know (0, 8) is on the graph of g. To find points to the right of (0, 8), multiply g(x) by 2.5 for every 1 unit increase in x. To find points to the left of (0, 8), divide g(x) by 2.5 for every 1 unit decrease in x.
Make table of values are shown below,
Plot the ordered pairs.
Draw a smooth curve through the points.
Conclusion:
The value get varies from
Chapter 6 Solutions
BIG IDEAS MATH Algebra 1: Common Core Student Edition 2015


 Algebra and Trigonometry (6th Edition)AlgebraISBN:9780134463216Author:Robert F. BlitzerPublisher:PEARSON
 Contemporary Abstract AlgebraAlgebraISBN:9781305657960Author:Joseph GallianPublisher:Cengage Learning
 Linear Algebra: A Modern IntroductionAlgebraISBN:9781285463247Author:David PoolePublisher:Cengage Learning
 Algebra And Trigonometry (11th Edition)AlgebraISBN:9780135163078Author:Michael SullivanPublisher:PEARSON
 Introduction to Linear Algebra, Fifth EditionAlgebraISBN:9780980232776Author:Gilbert StrangPublisher:Wellesley-Cambridge Press
 College Algebra (Collegiate Math)AlgebraISBN:9780077836344Author:Julie Miller, Donna GerkenPublisher:McGraw-Hill Education