
Concept explainers
Videos
Seat Designs. In Exercises 13–20, use the data in the table below for sitting adult males and females (based on anthropometric survey data from Gordon, Churchill, et al.). These data are used often in the design of different seats, including aircraft seats, train seats, theater seats, and classroom seats. (Hint: Draw a graph in each case.)
Sitting Back-to-Knee Length (inches)
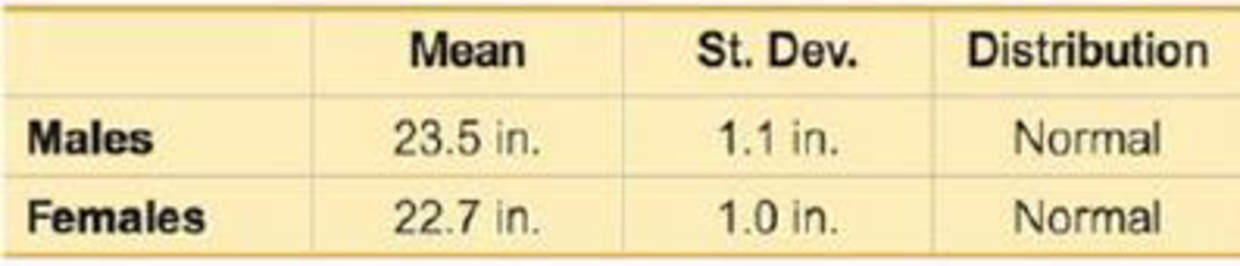
18. For females, find the first quartile Q1, which is the length separating the bottom 25% from the top 75%.

Learn your wayIncludes step-by-step video

Chapter 6 Solutions
Essentials of Statistics (6th Edition)
Additional Math Textbook Solutions
Introductory Statistics (2nd Edition)
Introductory Statistics (10th Edition)
Intro Stats, Books a la Carte Edition (5th Edition)
Elementary Statistics: Picturing the World (6th Edition)
Elementary Statistics: Picturing the World (7th Edition)


- Review the examples done in class of a cube with a side of 1cm,2cm, and 4cm and their SA/V ratios. Using data from all 5 cubes (1cm,2cm,4cm,3cm, and 30cm) create a table for the data including side length, surface area, volume, and SA/V ratio.arrow_forwardCont. * Mast. * Prop. Pie APRI. Chec. | Chec.. b Verif.. g 05-. 04 - MA.. A Mast.. M Math. Mind. The value y (in 1982-1984 dollars) of each dollar paid by consumers in each of the years from 1994 through 2008 in a country is represented by the ordered pairs. (1994, 0.676) (1996, 0.638) (1998, 0.608) (2000, 0.584) (2002, 0.556) (2004, 0.528) (2006, 0.494) (2008, 0.461) (1995, 0.658) (1997, 0.622) (1999, 0.599) (2001, 0.568) (2003, 0.543) (2005, 0.509) (2007, 0.486) (a) Use a spreadsheet software program to generate a scatter plot of the data. Let t = 4 represent 1994. Do the data appear linear? O Yes O No (b) Use the regression feature of the spreadsheet software program to find a linear model for the data. (Let t represent time. Round your numerical values to four decimal places.) y = (c) Use the model to predict the value (in 1982-1984 dollars) of 1 dollar paid by consumers in 2010 and in 2013. (Round your answers to two decimal places.) 2010 $4 2013 $4 Discuss the reliability of your…arrow_forwardpart D E ,.,arrow_forward
- Find the coordinates of point C using the data given below.arrow_forwardUse the data provided on Canvas. In automotive assembly processes, automation cannot always guarantee the dimensional accuracy of a car assembly as required by the design specification. Thus, some skillful workers will visually inspect those assembled car bodies and conduct manual adjustments when necessary. These workers are called "Fitter" in the automotive industry. This scenario is illustrated in the followingarrow_forwardPart a,b .on paper please .thank youarrow_forward
- The scatter plot gives the average atmospheric concentration of a gas and the average global temperature for six selected years. Shown on the scatter plot is a line that passes through or near the six points. Use this line to answer the questions in parts a. to d. (A calculator is recommended.) Concentration of a Gas and Global Temperature 58.2- 58.0- 370p7.07) 57.8 a. Use the two points whose coordinates are shown on the graph to write the point-slope form of the line that models the average global temperature, y, for an atmospheric gas concentration of x parts per million. 57.6- 57.4- The point-slope form of the equation is (Simplify your answer. Use integers or decimals for any numbers in the equation. Round to two decimal places as needed.) 57.24 (327.51.07) 57.0- b. Write the equation from part (a) in slope-intercept form. Use function notation. 56.8+ 310 320 330 340 350 360 370 380 390 Average Concentration of a Gas Using function notation, the slope-intercept form of the…arrow_forwardKk.171.arrow_forwardmm.3 Find the centriod of the regionarrow_forward
 MATLAB: An Introduction with ApplicationsStatisticsISBN:9781119256830Author:Amos GilatPublisher:John Wiley & Sons Inc
 Probability and Statistics for Engineering and th...StatisticsISBN:9781305251809Author:Jay L. DevorePublisher:Cengage Learning
 Statistics for The Behavioral Sciences (MindTap C...StatisticsISBN:9781305504912Author:Frederick J Gravetter, Larry B. WallnauPublisher:Cengage Learning
 Elementary Statistics: Picturing the World (7th E...StatisticsISBN:9780134683416Author:Ron Larson, Betsy FarberPublisher:PEARSON
 The Basic Practice of StatisticsStatisticsISBN:9781319042578Author:David S. Moore, William I. Notz, Michael A. FlignerPublisher:W. H. Freeman
 Introduction to the Practice of StatisticsStatisticsISBN:9781319013387Author:David S. Moore, George P. McCabe, Bruce A. CraigPublisher:W. H. Freeman