Elementary Statistics (Text Only)
2nd Edition
ISBN: 9780077836351
Author: Author
Publisher: McGraw Hill
bartleby

Concept explainers

bartleby

Videos

Textbook Question
Book Icon
Chapter 6.1, Problem 49E

School days: The following table presents the numbers of students enrolled in grades 1 through 8 in public schools in the United States.
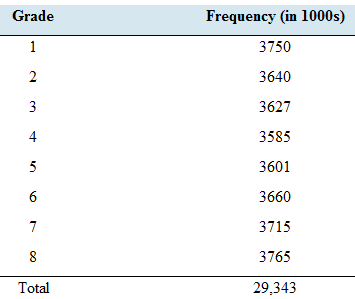
Chapter 6.1, Problem 49E, School days: The following table presents the numbers of students enrolled in grades 1 through 8 in

Consider these students to be a population. Let X be the grade of a student randomly chosen from this population.

Construct the probability distribution of X.

Find the probability that the student is in fourth grade.

Find the probability that the student is seventh or eighth grade.

Compute the mean μ X .

Compute the standard σ X .

a.

Expert Solution
Check Mark
To determine

To construct: The probability distribution of the given random variable.

Explanation of Solution

The enrollment of students from grade 1 to grade 8 is given in the following table. The frequency is in thousands. .

  GradeFrequency1375023640336274358553601636607371583765Total29,343

Calculation:

The random variable (X) is considered as the grade.

To calculate the probability of each value of the random variable, the frequency should be divided by the total number of individuals according to the formula,

  P(A)=n(A)n(S)

As an example,

  P(x=1)=3,750,00029,343,000=0.1278

The all calculation can be expressed in a table as follows. Because both values in the numerator and the denominator is in thousands, in the division those are cancelled out.

  xfP(x)13750 3750 29,343=0.127823640 3640 29,343=0.124133627 3627 29,343=0.123643585 3585 29,343=0.122253601 3601 29,343=0.122763660 3660 29,343=0.124773715 3715 29,343=0.126683765 3765 29,343=0.1283

The probability distribution can be constructed by the first and third columns of the above table.

  xP(x)10.127820.124130.123640.122250.122760.124770.126680.1283

b.

Expert Solution
Check Mark
To determine

To find: The probability to a selected student is from grade four.

Answer to Problem 49E

The probability that the student is in fourth grade is found to be 0.1222 .

Explanation of Solution

The probability distribution for the grade of 29,343 thousand students is constructed as follows in the part (a).

  x12345678P(x)0.12780.12410.12360.12220.12270.12470.12660.1283

Calculation:

When a student is fin grade four, the random variable x is equal to four; x=0 .

The relevant probability is calculated in a precious part as,

  P(x=4)=3,585,00029,343,000P(4)=0.1222

Conclusion:

The probability of x=4 is found to be 0.1222 .

c.

Expert Solution
Check Mark
To determine

To find: The probability to a selected student is in grade seven or eight.

Answer to Problem 49E

The probability that the student is seventh or eighth grade is found to be 0.2549 .

Explanation of Solution

The probability distribution for the grade of 29,343 thousand students is constructed as follows in the part (a).

  x12345678P(x)0.12780.12410.12360.12220.12270.12470.12660.1283

Calculation:

Same student cannot enroll to two different grades. Hence, being a grade seven student and being a grade eight student are two mutually exclusive events.

Therefore, the probability for this combination can be written as,

  P(7 or 8)

By the addition rule, this probability should be equal to

  P(x=7)+P(x=8)

The total probability can be determined as,

  P(7)+P(8)=0.1266+0.1283=0.2549

Conclusion:

The probability of P(7 or 8) is found to be 0.2549 .

d.

Expert Solution
Check Mark
To determine

To find: The mean of grade of the student.

Answer to Problem 49E

The mean is found to be,

  μX=4.5101

Explanation of Solution

The probability distribution for the grade of 29,343 thousand students is constructed as follows in the part (a).

  x12345678P(x)0.12780.12410.12360.12220.12270.12470.12660.1283

Calculation:

The mean of a random variable, or equivalently the expected value is given by the sum of the product of the values and the corresponding probabilities.

  μX=E(X)=x1P1+x2P2+x3P3+...

Here, for each value of x should be multiplied by the probabilities and added.

  μX=(1×0.1278)+(2×0.1241)+(3×0.1236) +(4×0.1222)+(5×0.1227)+(6×0.1247)+(7×0.1266)+(8×0.1283)=0.1278+0.2481+0.3708+0.4887+0.6136+0.7484+0.8862+1.0265μX=4.5101

Conclusion:

The mean is found to be 4.5101 .

e.

Expert Solution
Check Mark
To determine

To find: The standard deviation of X .

Answer to Problem 49E

The standard deviation is found to be,

  σX=2.3073

Explanation of Solution

The probability distribution for the grade of 29,343 thousand students is constructed as follows in the part (a).

  x12345678P(x)0.12780.12410.12360.12220.12270.12470.12660.1283

Calculation:

The variance of a random variable (σX2) is given by the formula,

  σX2=[( x μ X )P( x)]2

By constructing a table we can do the calculations clearly using the mean of 4.5101 .

  xxμX ( x μ X )2P(x) ( x μ X )2P(x)13.510112.32110.12781.574622.51016.30080.12410.781631.51012.28050.12360.281940.51010.26020.12220.031850.48990.23990.12270.029461.48992.21970.12470.276972.48996.19940.12660.784983.489912.17910.12831.5627

The sum of right-most column gives the variation of X .

  σX2=5.3238

The standard deviation (σX) is the square root of variance. Hence,

  σX=σX2=5.3238σX=2.3073

Conclusion:

The standard deviation is found to be 2.3073 .

Want to see more full solutions like this?

Subscribe now to access step-by-step solutions to millions of textbook problems written by subject matter experts!
Students have asked these similar questions
Introduce yourself and describe a time when you used data in a personal or professional decision. This could be anything from analyzing sales data on the job to making an informed purchasing decision about a home or car. Describe to Susan how to take a sample of the student population that would not represent the population well. Describe to Susan how to take a sample of the student population that would represent the population well. Finally, describe the relationship of a sample to a population and classify your two samples as random, systematic, cluster, stratified, or convenience.
1.2.17. (!) Let G,, be the graph whose vertices are the permutations of (1,..., n}, with two permutations a₁, ..., a,, and b₁, ..., b, adjacent if they differ by interchanging a pair of adjacent entries (G3 shown below). Prove that G,, is connected. 132 123 213 312 321 231
You are planning an experiment to determine the effect of the brand of gasoline and the weight of a car on gas mileage measured in miles per gallon. You will use a single test car, adding weights so that its total weight is 3000, 3500, or 4000 pounds. The car will drive on a test track at each weight using each of Amoco, Marathon, and Speedway gasoline. Which is the best way to organize the study? Start with 3000 pounds and Amoco and run the car on the test track. Then do 3500 and 4000 pounds. Change to Marathon and go through the three weights in order. Then change to Speedway and do the three weights in order once more. Start with 3000 pounds and Amoco and run the car on the test track. Then change to Marathon and then to Speedway without changing the weight. Then add weights to get 3500 pounds and go through the three gasolines in the same order.Then change to 4000 pounds and do the three gasolines in order again. Choose a gasoline at random, and run the car with this gasoline at…

Chapter 6 Solutions

Elementary Statistics (Text Only)

Ch. 6.1 - In Exercises 17-26, determine whether the random...Ch. 6.1 - In Exercises 17-26, determine whether the random...Ch. 6.1 - In Exercises 17-26, determine whether the random...Ch. 6.1 - In Exercises 17-26, determine whether the random...Ch. 6.1 - In Exercises 17-26, determine whether the random...Ch. 6.1 - In Exercises 17-26, determine whether the random...Ch. 6.1 - In Exercises 17-26, determine whether the random...Ch. 6.1 - In Exercises 17-26, determine whether the random...Ch. 6.1 - In Exercises 27-32, determine whether the table...Ch. 6.1 - In Exercises 27-32, determine whether the table...Ch. 6.1 - In Exercises 27-32, determine whether the table...Ch. 6.1 - In Exercises 27-32, determine whether the table...Ch. 6.1 - In Exercises 27-32, determine whether the table...Ch. 6.1 - Prob. 32ECh. 6.1 - In Exercises 33-38, compute the mean and standard...Ch. 6.1 - In Exercises 33-38, compute the mean and standard...Ch. 6.1 - In Exercises 33-38, compute the mean and standard...Ch. 6.1 - Prob. 36ECh. 6.1 - In Exercises 33-38, compute the mean and standard...Ch. 6.1 - In Exercises 33-38, compute the mean and standard...Ch. 6.1 - Fill in the value so that the following table...Ch. 6.1 - Fill in the missing value so that the following...Ch. 6.1 - Put some air in your tires: Let X represent the...Ch. 6.1 - Fifteen items or less: The number of customers in...Ch. 6.1 - Defective circuits: The following table presents...Ch. 6.1 - Do you carpool? Let X represent the number of...Ch. 6.1 - Dirty air: The federal government has enacted...Ch. 6.1 - Prob. 46ECh. 6.1 - Relax! The General Social Survey asked 1676 people...Ch. 6.1 - Pain: The General Social Survey asked 827 people...Ch. 6.1 - School days: The following table presents the...Ch. 6.1 - World Cup: The World Cup soccer tournament has...Ch. 6.1 - Lottery: In the New York State Numbers Lottery:...Ch. 6.1 - Lottery: In the New York State Numbers Lottery,...Ch. 6.1 - Craps: In the game of craps, two dice are rolled,...Ch. 6.1 - Prob. 54ECh. 6.1 - Prob. 55ECh. 6.1 - Prob. 56ECh. 6.1 - Prob. 57ECh. 6.1 - Insurance: An insurance company sells a one-year...Ch. 6.1 - Prob. 59ECh. 6.1 - Prob. 60ECh. 6.1 - Prob. 61ECh. 6.2 - In Exercises 5-7, fill in each blank with the...Ch. 6.2 - In Exercises 5-7, fill in each blank with the...Ch. 6.2 - In Exercises 5-7, fill in each blank with the...Ch. 6.2 - Prob. 8ECh. 6.2 - In Exercises 8-10, determine whether the statement...Ch. 6.2 - In Exercises 8-10, determine whether the statement...Ch. 6.2 - In Exercises 11-16, determine whether the random...Ch. 6.2 - In Exercises 11-16, determine whether the random...Ch. 6.2 - In Exercises 11-16, determine whether the random...Ch. 6.2 - Prob. 14ECh. 6.2 - In Exercises 11-16, determine whether the random...Ch. 6.2 - Prob. 16ECh. 6.2 - In Exercises 17-26, determine the indicated...Ch. 6.2 - Prob. 18ECh. 6.2 - In Exercises 17-26, determine the indicated...Ch. 6.2 - In Exercises 17-26, determine the indicated...Ch. 6.2 - In Exercises 17-26, determine the indicated...Ch. 6.2 - In Exercises 17-26, determine the indicated...Ch. 6.2 - In Exercises 17-26, determine the indicated...Ch. 6.2 - In Exercises 17-26, determine the indicated...Ch. 6.2 - In Exercises 17-26, determine the indicated...Ch. 6.2 - Prob. 26ECh. 6.2 - Take a guess: A student takes a true-false test...Ch. 6.2 - Take another guess: A student takes a...Ch. 6.2 - Your flight has been delayed: At Denver...Ch. 6.2 - Car inspection: Of all the registered automobiles...Ch. 6.2 - Google it: According to a report of the Nielsen...Ch. 6.2 - What should I buy? A study conducted by the Pew...Ch. 6.2 - Blood types: The blood type O negative is called...Ch. 6.2 - Coronary bypass surgery: The Agency for Healthcare...Ch. 6.2 - College bound: The Statistical Abstract of the...Ch. 6.2 - Big babies: The Centers for Disease Control and...Ch. 6.2 - High blood pressure: The National Health and...Ch. 6.2 - Prob. 38ECh. 6.2 - Testing a shipment: A certain large shipment comes...Ch. 6.2 - Smoke detectors: An company offers a discount to...Ch. 6.2 - Prob. 41ECh. 6.3 - In Exercises 5 and 6, fill in each blank with the...Ch. 6.3 - Prob. 6ECh. 6.3 - Prob. 7ECh. 6.3 - Prob. 8ECh. 6.3 - Prob. 9ECh. 6.3 - Prob. 10ECh. 6.3 - Prob. 11ECh. 6.3 - Prob. 12ECh. 6.3 - Prob. 13ECh. 6.3 - Prob. 14ECh. 6.3 - Prob. 15ECh. 6.3 - Prob. 16ECh. 6.3 - Prob. 17ECh. 6.3 - Prob. 18ECh. 6.3 - Prob. 19ECh. 6.3 - Flaws in aluminum foil: The number of flaws in a...Ch. 6.3 - Prob. 21ECh. 6.3 - Prob. 22ECh. 6.3 - Computer messages: The number of tweets received...Ch. 6.3 - Prob. 24ECh. 6.3 - Trees in the forest: The number of trees of a...Ch. 6.3 - Prob. 26ECh. 6.3 - Drive safely: In a recent year, there were...Ch. 6.3 - Prob. 28ECh. 6.3 - Prob. 29ECh. 6 - Explain why the following is not a probability...Ch. 6 - Find die mean of the random variable X with the...Ch. 6 - Refer to Problem 2. the variance of the random...Ch. 6 - Prob. 4CQCh. 6 - Prob. 5CQCh. 6 - Prob. 6CQCh. 6 - Prob. 7CQCh. 6 - Prob. 8CQCh. 6 - At a cell phone battery plant. 5% of cell phone...Ch. 6 - Refer to Problem 9. Find the mean and standard...Ch. 6 - A meteorologist states that the probability of...Ch. 6 - Prob. 12CQCh. 6 - Prob. 13CQCh. 6 - Prob. 14CQCh. 6 - Prob. 15CQCh. 6 - Prob. 1RECh. 6 - Prob. 2RECh. 6 - Prob. 3RECh. 6 - Prob. 4RECh. 6 - Lottery tickets: Several million lottery tickets...Ch. 6 - Prob. 6RECh. 6 - Prob. 7RECh. 6 - Prob. 8RECh. 6 - Reading tests: According to the National Center...Ch. 6 - Prob. 10RECh. 6 - Prob. 11RECh. 6 - Prob. 12RECh. 6 - Prob. 13RECh. 6 - Prob. 14RECh. 6 - Prob. 15RECh. 6 - Prob. 1WAICh. 6 - Prob. 2WAICh. 6 - Prob. 3WAICh. 6 - When a population mean is unknown, people will...Ch. 6 - Provide an example of a random variable and...Ch. 6 - Prob. 6WAICh. 6 - Prob. 7WAICh. 6 - Prob. 1CS
Knowledge Booster
Background pattern image
Statistics
Learn more about
Need a deep-dive on the concept behind this application? Look no further. Learn more about this topic, statistics and related others by exploring similar questions and additional content below.
Similar questions
SEE MORE QUESTIONS
Recommended textbooks for you
Text book image
Glencoe Algebra 1, Student Edition, 9780079039897...
Algebra
ISBN:9780079039897
Author:Carter
Publisher:McGraw Hill
Mod-01 Lec-01 Discrete probability distributions (Part 1); Author: nptelhrd;https://www.youtube.com/watch?v=6x1pL9Yov1k;License: Standard YouTube License, CC-BY
Discrete Probability Distributions; Author: Learn Something;https://www.youtube.com/watch?v=m9U4UelWLFs;License: Standard YouTube License, CC-BY
Probability Distribution Functions (PMF, PDF, CDF); Author: zedstatistics;https://www.youtube.com/watch?v=YXLVjCKVP7U;License: Standard YouTube License, CC-BY
Discrete Distributions: Binomial, Poisson and Hypergeometric | Statistics for Data Science; Author: Dr. Bharatendra Rai;https://www.youtube.com/watch?v=lHhyy4JMigg;License: Standard Youtube License