Concept explainers
Videos
Problems 6.19 through 6.22 relate to the comparison of two sinusoidal input signals using a dual-trace oscilloscope. A schematic diagram of the measurement system is shown in Figure 6.40, in which one of the signals is assumed to be a reference standard signal, having a known frequency and amplitude. The oscilloscope trace (Input signal versus Reference signal or X versus Y) for these inputs is called a Lissajous diagram. The problems can also be worked in the laboratory.
Develop the characteristic shape of the Lissajous diagrams for two sinusoidal inputs having the same amplitude, but with the following phase relationships:
- in phase
- ±90 degrees out of phase
- 180 degrees out of phase
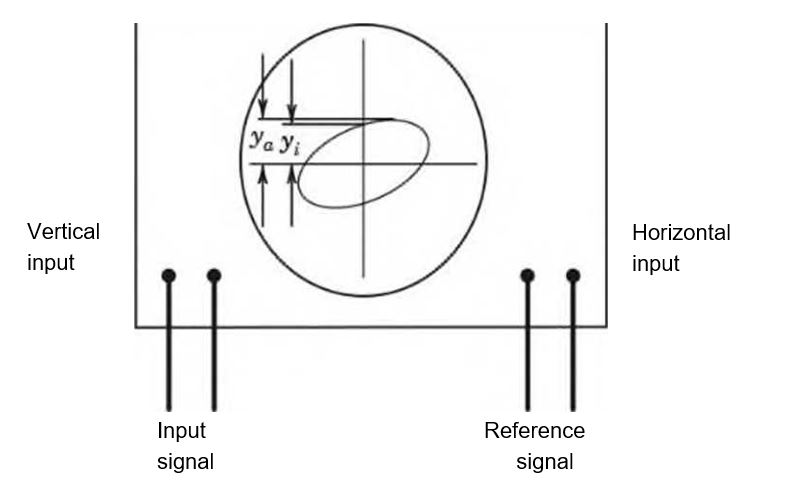
Figure 6.40 Dual-trace oscilloscope for measuring signal characteristics by using Lissajous diagrams.
- Show that the phase angle for two sinusoidal signals can be determined from the relationship sin O = yjya
- Draw a schematic diagram of a measurement system to determine the phase lag resulting from an electronic circuit. Your schematic diagram should include a reference signal, the electronic circuit, and the dual-trace oscilloscope. Discuss the expected result and how a quantitative estimate of the phase lag can be determined.
- Construct Lissajous diagrams for sinusoidal inputs to a dual trace oscilloscope having the following horizontal signal to vertical signal frequency ratios: (a) 1:1, (b) 1:2, (c) 2:1, (d) 1:3, (e) 2:3, (0 5:2. These plots can be easily developed using spreadsheet software and plotting a sufficient number of cycles of each of the input signals.
where the values of y f and yaare illustrated in Figure 6.40 and represent the vertical distance to they intercept and the maximumy value, respectively.
Want to see the full answer?
Check out a sample textbook solution
Chapter 6 Solutions
Theory and Design for Mechanical Measurements


- 1. Sketch and define a sinusoidal signal by labelling its cycle, time duration and magnitude.arrow_forwardIn this Problem, the system of Fig. 5.4.14 (Attached) is taken as a model for an undamped car with the given parameters in fps units. (a) Find the two natural frequencies of oscillation (in hertz). (b) Assume that this car is driven along a sinusoidal washboard surface with a wavelength of 40 ft. Find thetwo critical speeds. m = 100, I =1000, L1 =6, L2 = 4, k1 = k2 = 2000arrow_forwardA step test of a transducer shows a signal having a damped oscillation decaying to a steady value. If the period of oscillation is 0.577 ms, what is the transducer ringing frequency?arrow_forward
- Consider the Wheatstone bridge shown in the image. Suppose: R3 = R4 200 ΩR2 = variable calibrated resistorR1 = transducer resistance 40x + 100 When x =0, what is the value of R2 required to balance the bridge? If the bridge is operated in a balanced condition in order to measure x, determine the relationship between R2 and x.arrow_forwardProblem 4-1: During a step function calibration, a first-order instrument is exposed to a step change of 100 units. If after 1.2 s the instrument indicates 80 units, estimate the instrument time constant. Estimate the error in the indicated value after 1.5 s. For this instrument, y (0) = 0 units; K = 1 unit/unit.arrow_forwardThe octave band levels measured by an instrument with perfectly flat frequency response are 78,76,78,82,81,80,80,73, and 65 dB re 20 pPa for the octave bands centered at 31.5,63,125,250,500,1000,2000,4000, and 8000 Hz respectively. Calculate the band levels that would be measured by a sound level meter set to (a) C-weighted and (b) A-weightedarrow_forward
- Q.5 Use normal mode analysis to find the natural frequencies of the system shown below: The specific values of m2 =6, k2 =150 m2 k2 m = 2 kg %3D k = 40 N/marrow_forwardThe waveform displayed on an oscilloscope is as shown in Figure The 'time/cm' switch is set to 20ms/cm, and the 'volts/cm' switch is set to 30 V/cm. Determine the (i) amplitude of waveform Q. (ii)peak to peak value of waveform P, (iii) frequency of waveform P and (iv) phase angle difference between P and Q in Degrees and (v) Rm.s value of waveform Q. P.arrow_forwardA kid is plating on a swing and it takes approximately 2.5 seconds to reach on side coming from the other. What is her frequency in Hz?arrow_forward
- 2. Determine the Average and RMS value for the function y (t) = 25 + 10 sin 6nt over the time period "O to 0.1" sec Comment on the nature and meaning of the results in terms of analysis of dynamic signals.arrow_forwardQ2. For the two degree of freedom system shown in Fig.2, determine the natural frequencies and the mode shapes for the system. k k Зт Fig. 2: Two Degree of Freedom System.arrow_forwardFor the calibration data given in Table Q2(c), plot the calibration curve using suitable axes. Estimate the static sensitivity of the system at the midrange.arrow_forward
 Elements Of ElectromagneticsMechanical EngineeringISBN:9780190698614Author:Sadiku, Matthew N. O.Publisher:Oxford University Press
 Mechanics of Materials (10th Edition)Mechanical EngineeringISBN:9780134319650Author:Russell C. HibbelerPublisher:PEARSON
 Thermodynamics: An Engineering ApproachMechanical EngineeringISBN:9781259822674Author:Yunus A. Cengel Dr., Michael A. BolesPublisher:McGraw-Hill Education
 Control Systems EngineeringMechanical EngineeringISBN:9781118170519Author:Norman S. NisePublisher:WILEY
 Mechanics of Materials (MindTap Course List)Mechanical EngineeringISBN:9781337093347Author:Barry J. Goodno, James M. GerePublisher:Cengage Learning
 Engineering Mechanics: StaticsMechanical EngineeringISBN:9781118807330Author:James L. Meriam, L. G. Kraige, J. N. BoltonPublisher:WILEY