Concept explainers
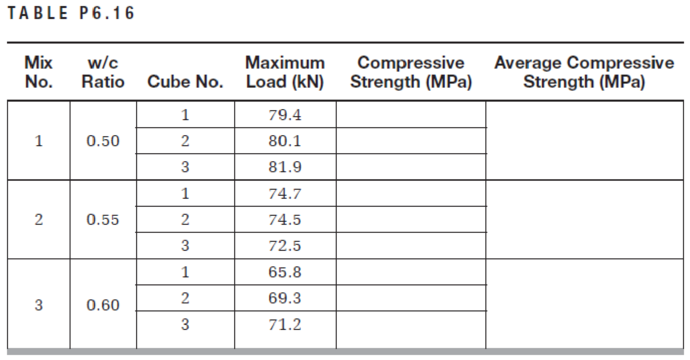
Students in the materials class prepared three mortar mixes with water to cement ratios of 0.50, 0.55, and 0.60. Three 50-mm mortar cubes were prepared for each mix. The cubes were cured for 7 days and then tested for compressive strength. The test results were as shown in Table P6.16.

Determine the following:
a. The compressive strength of each cube.
b. The average compressive strength for each mix.
c. Plot the average compressive strength versus w/c ratios for all mixes.
d. Comment on the effect of increasing w/c ratio on the compressive strength of the cubes.
Want to see the full answer?
Check out a sample textbook solution
Chapter 6 Solutions
Pearson eText for Materials for Civil and Construction Engineers -- Instant Access (Pearson+)
Additional Engineering Textbook Solutions
Vector Mechanics For Engineers
Management Information Systems: Managing The Digital Firm (16th Edition)
Thermodynamics: An Engineering Approach
Starting Out with Programming Logic and Design (5th Edition) (What's New in Computer Science)
Electric Circuits. (11th Edition)
Database Concepts (8th Edition)
- P.3.4 A mercury U-tube manometer is used to measure the pressure drop across an orifice in pipe. If the liquid that flowing through the orifice is brine of sp.gr. 1.26 and upstream pressure is 2 psig and the downstream pressure is (10 in Hg) vacuum, find the reading of manometer. Ans. R=394 mm Hgarrow_forwardProject management questionarrow_forwardQ5/B with Explantion plsarrow_forward
- project management question Q5/Barrow_forwardProblem 1: Given: In a given floor system, a 5-in concrete slab supported by T-beams of 24-ft spans, supporting 354 psf live load. The T-beams are spaced 2x4 ft on center, and bw (width of the beam web) = 15 inches. Total T-beam height is 25 inches. f'c = 4,000psi, fy = 60,000psi. Design the T-beam. Show all steps. Sketch your Design. Problem 2: Given: A 25"x25" column is subject to a factored axial load of Pu=1,200 kips, and factored design moment of Mu-354 kips-ft. f'c 4,000psi, fy = 60,000psi. Determine the required steel ratio (p) and ties. Sketch the design. 2.0 0.08 INTERACTION DIAGRAM R4-60.9 fc-4 ksi 1.8 1,- 60 ksi 0.07 Y=0.9 16 1.6 0.06 Kmax 0.05 1.4 f/f, = 0 0.04 00 K₁ = P₁/f'c Ag 1.2 12 0.03 0.25 1.0 10 0.02 0.01 0.8 0.6 0.4 €,= 0.0035 0.2 €,= 0.0050 0.0 h yh 0.50 0.75 1.0. 0.00 0.05 0.10 0.15 0.20 0.25 0.30 0.35 0.40 0.45 0.50 R₁ = P₁e/f'Agharrow_forwardGiven: In a given floor system, a 5-in concrete slab supported by T-beams of 24-ft spans, supporting 354 psf live load. The T-beams are spaced 2x4 ft on center, and bw (width of the beam web) = 15 inches. Total T-beam height is 25 inches. f'c = 4,000psi, fy = 60,000psi. Design the T-beam. Show all steps. Sketch your Design.arrow_forward
- Problem 2: Given: A 25"x25" column is subject to a factored axial load of Pu=1,200 kips, and factored design moment of Mu-354 kips-ft. f'c 4,000psi, fy = 60,000psi. Determine the required steel ratio (p) and ties. Sketch the design. 2.0 P=0.08 INTERACTION DIAGRAM R4-60.9 fc-4 ksi 1.8 1,- 60 ksi 0.07 7=0.9 1.6 16 0.06 Kmax 0.05 1.4 f/f, = 0 0.04 90 K₁ = P₁/f'Ag 1.2 0.03 0.25 0.02 1.0 0.01 0.8 0.6 0.4 €= 0.0035 0.2 €,= 0.0050 0.0 h yh 0.50 0.75 1.0. 0.00 0.05 0.10 0.15 0.20 0.25 0.30 0.35 0.40 0.45 0.50 R₁ = P₁e/f'Aharrow_forwardGiven: A 25"x25" column is subject to a factored axial load of Pu=1,200 kips, and factored design moment of Mu=354 kips-ft. f'c 4,000psi, fy = 60,000psi. Determine the required steel ratio () and ties. Sketch the design.arrow_forwardSee Figure (1) below. A 14 in. wide and 2 in. thick plate subject to tensile loading has staggered holes as shown. Compute An and Ae. P 2.00 3.00 4.00 3.00 2.00 ΕΙ T A B C F G D S = 2.50 3/4" bolts in 13/16" holes 14x12 PL Parrow_forward

 Structural Analysis (10th Edition)Civil EngineeringISBN:9780134610672Author:Russell C. HibbelerPublisher:PEARSON
 Principles of Foundation Engineering (MindTap Cou...Civil EngineeringISBN:9781337705028Author:Braja M. Das, Nagaratnam SivakuganPublisher:Cengage Learning
 Fundamentals of Structural AnalysisCivil EngineeringISBN:9780073398006Author:Kenneth M. Leet Emeritus, Chia-Ming Uang, Joel LanningPublisher:McGraw-Hill Education
 Traffic and Highway EngineeringCivil EngineeringISBN:9781305156241Author:Garber, Nicholas J.Publisher:Cengage Learning


