
Concept explainers
Videos
Find the area under the standard
a. Between 0 and 1.50
b. Between 0 and −1.25
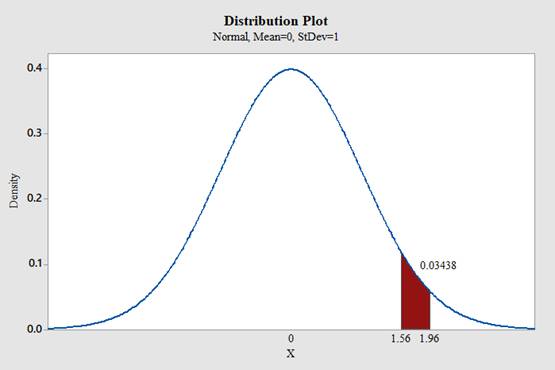
c. Between 1.56 and 1.96
d. Between −1.20 and −2.25
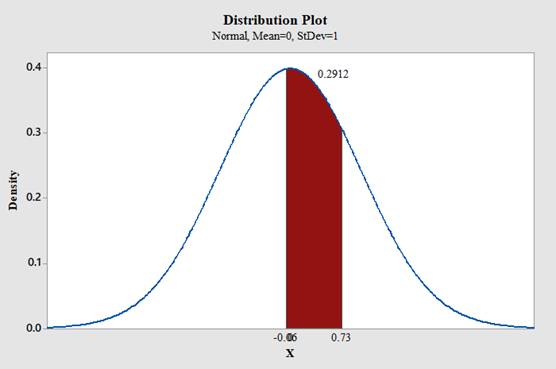
e. Between −0.06 and 0.73
f. Between 1.10 and −1.80
g. To the right of z = 1.75
h. To the right of z = −1.28
i. To the left of z = −2.12
j. To the left of z = 1.36
(a)
To find: The area under the standard normal distribution curve for
Answer to Problem 18CQ
The area under the standard normal distribution curve for
Explanation of Solution
Calculation:
Software procedure:
Use Minitab; find the area under the normal curve between 0 and 1.50 with the help of following instructions:
- Choose Graph > Probability Distribution Plot choose View Probability> OK.
- From Distribution, choose ‘Normal’ distribution.
- Enter the Mean as 0.0 and Standard deviation as 1.0.
- Click the Shaded Area tab.
- Click the picture for Middle.
- Type in the smaller value 0 for X value1 and then the larger value 1.50 for the X value2.
- Click OK.
Output using the MINITAB software is given below:
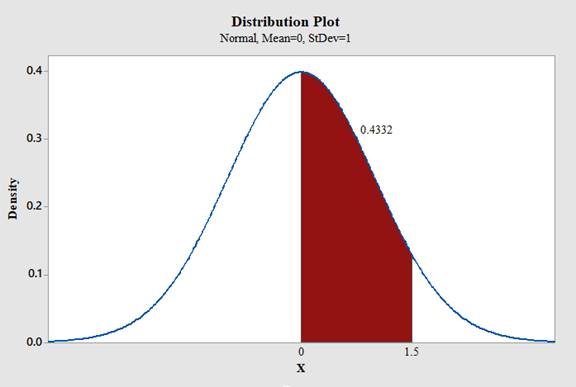
Therefore,
Conclusion:
The area under the standard normal distribution curve for
(b)
To find: The area under the standard normal distribution curve for
–1.25. That is,
Answer to Problem 18CQ
The area under the standard normal distribution curve for
Explanation of Solution
Calculation:
Software procedure:
Use Minitab; find the area under the normal curve between 0 and -1.25 with the help of following instructions:
- Choose Graph > Probability Distribution Plot choose View Probability> OK.
- From Distribution, choose ‘Normal’ distribution.
- Enter the Mean as 0.0 and Standard deviation as 1.0.
- Click the Shaded Area tab.
- Click the picture for Middle.
- Type in the smaller value -1.25 for X value1 and then the larger value 0 for the X value2.
- Click OK.
Output using the MINITAB software is given below:
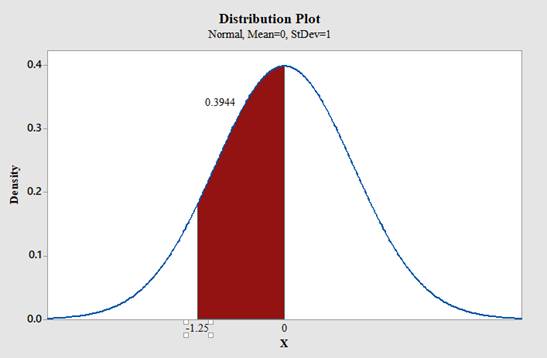
Therefore,
Conclusion:
The area under the standard normal distribution curve for
(c)
To find: The area under the standard normal distribution curve for
Answer to Problem 18CQ
The area under the standard normal distribution curve for
Explanation of Solution
Calculation:
Software procedure:
Use Minitab; find the area under the normal curve between 1.56 and 1.96 with the help of following instructions:
- Choose Graph > Probability Distribution Plot choose View Probability> OK.
- From Distribution, choose ‘Normal’ distribution.
- Enter the Mean as 0.0 and Standard deviation as 1.0.
- Click the Shaded Area tab.
- Click the picture for Middle.
- Type in the smaller value 1.56 for X value1 and then the larger value 1.96 for the X value2.
- Click OK.
Output using the MINITAB software is given below:
 .
.
Therefore,
Conclusion:
The area under the standard normal distribution curve for
(d)
To find: The area under the standard normal distribution curve for
Answer to Problem 18CQ
The area under the standard normal distribution curve for
Explanation of Solution
Calculation:
Software procedure:
Use Minitab; find the area under the normal curve between -1.20 and -2.25 with the help of following instructions:
- Choose Graph > Probability Distribution Plot choose View Probability> OK.
- From Distribution, choose ‘Normal’ distribution.
- Enter the Mean as 0.0 and Standard deviation as 1.0.
- Click the Shaded Area tab.
- Click the picture for Middle.
- Type in the smaller value -2.25 for X value1 and then the larger value -1.20 for the X value2.
- Click OK.
Output using the MINITAB software is given below:
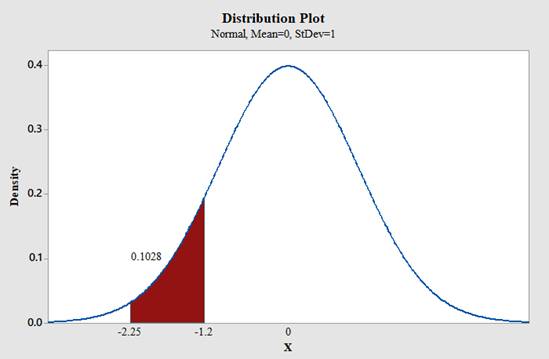
Therefore,
Conclusion:
The area under the standard normal distribution curve for
(e)
To find: The area under the standard normal distribution curve for
Answer to Problem 18CQ
The area under the standard normal distribution curve for
Explanation of Solution
Calculation:
Software procedure:
Use Minitab; find the area under the normal curve between -0.06 and 0.73 with the help of following instructions:
- Choose Graph > Probability Distribution Plot choose View Probability> OK.
- From Distribution, choose ‘Normal’ distribution.
- Enter the Mean as 0.0 and Standard deviation as 1.0.
- Click the Shaded Area tab.
- Click the picture for Middle.
- Type in the smaller value -0.06 for X value1 and then the larger value 0.73 for the X value2.
- Click OK.
Output using the MINITAB software is given below:
 .
.
Therefore,
Conclusion:
The area under the standard normal distribution curve for
(f)
To find: The area under the standard normal distribution curve for
Answer to Problem 18CQ
The area under the standard normal distribution curve for
Explanation of Solution
Calculation:
Software procedure:
Use Minitab; find the area under the normal curve between 1.10 and -1.80 with the help of following instructions:
- Choose Graph > Probability Distribution Plot choose View Probability> OK.
- From Distribution, choose ‘Normal’ distribution.
- Enter the Mean as 0.0 and Standard deviation as 1.0.
- Click the Shaded Area tab.
- Click the picture for Middle.
- Type in the smaller value -1.80 for X value1 and then the larger value 1.10 for the X value2.
- Click OK.
Output using the MINITAB software is given below:
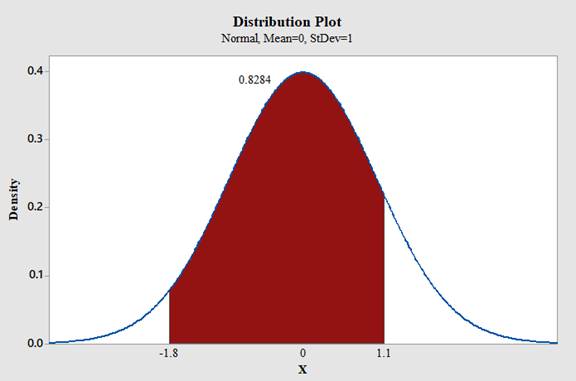
Therefore,
Conclusion:
The area under the standard normal distribution curve for
(g)
To find: The area under the standard normal curve to the right of
Answer to Problem 18CQ
The area under the standard normal curve to the right of
Explanation of Solution
Calculation:
Software procedure:
Use Minitab; find the area under the normal curve to the right of 1.75 with the help of following instructions:
- Choose Graph > Probability Distribution Plot choose View Probability> OK.
- From Distribution, choose ‘Normal’ distribution.
- Enter the Mean as 0.0 and Standard deviation as 1.0.
- Click the Shaded Area tab.
- Click the picture for Right Trail.
- Type in the Z value of 1.75 and click OK.
Output using the MINITAB software is given below:
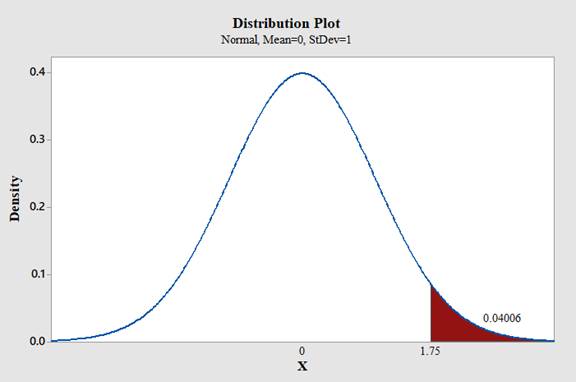
Therefore,
Conclusion:
The area under the standard normal curve to the right of
(h)
To find: The area under the standard normal curve to the right of
Answer to Problem 18CQ
The area under the standard normal curve to the right of
Explanation of Solution
Calculation:
Software procedure:
Use Minitab; find the area under the normal curve to the right of -1.28 with the help of following instructions:
- Choose Graph > Probability Distribution Plot choose View Probability> OK.
- From Distribution, choose ‘Normal’ distribution.
- Enter the Mean as 0.0 and Standard deviation as 1.0.
- Click the Shaded Area tab.
- Click the picture for Right Trail.
- Type in the Z value of -1.28 and click OK.
Output using the MINITAB software is given below:
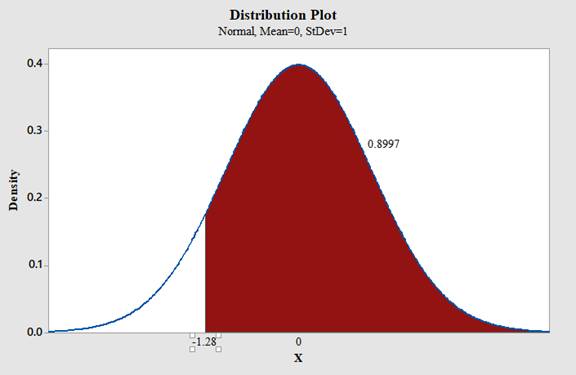
Therefore,
Conclusion:
The area under the standard normal curve to the right of
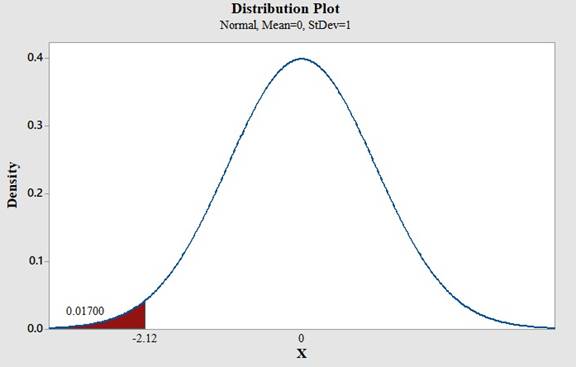
(i)
To find: The area under the standard normal curve to the left of
Answer to Problem 18CQ
The area under the standard normal curve to the left of
Explanation of Solution
Calculation:
Software procedure:
Use Minitab; find the area under the normal curve to the left of -2.12 with the help of following instructions:
- Choose Graph > Probability Distribution Plot choose View Probability> OK.
- From Distribution, choose ‘Normal’ distribution.
- Enter the Mean as 0.0 and Standard deviation as 1.0.
- Click the Shaded Area tab.
- Click the picture for Left Trail.
- Type in the Z value of -2.12 and click OK.
Output using the MINITAB software is given below:
Therefore,
Conclusion:
The area under the standard normal curve to the left of
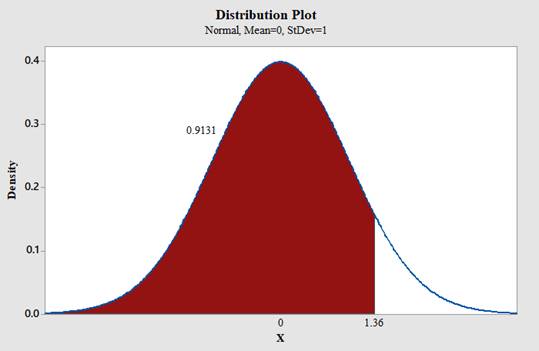
(j)
To find: The area under the standard normal curve to the left of
Answer to Problem 18CQ
The area under the standard normal curve to the left of
Explanation of Solution
Calculation:
Software procedure:
Use Minitab; find the area under the normal curve to the left of 1.36 with the help of following instructions:
- Choose Graph > Probability Distribution Plot choose View Probability> OK.
- From Distribution, choose ‘Normal’ distribution.
- Enter the Mean as 0.0 and Standard deviation as 1.0.
- Click the Shaded Area tab.
- Click the picture for Left Trail.
- Type in the Z value of 1.36 and click OK.
Output using the MINITAB software is given below:
Therefore,
Conclusion:
The area under the standard normal curve to the left of
Want to see more full solutions like this?
Chapter 6 Solutions
ELEMENTARY STATISTICS: STEP BY STEP- ALE


 Calculus For The Life SciencesCalculusISBN:9780321964038Author:GREENWELL, Raymond N., RITCHEY, Nathan P., Lial, Margaret L.Publisher:Pearson Addison Wesley,