a)
The question requires us to draw a diagram for the
a)
Explanation of Solution
Money market represents the relationship between the quantity of money supplied and demanded at different interest levels in an economy.
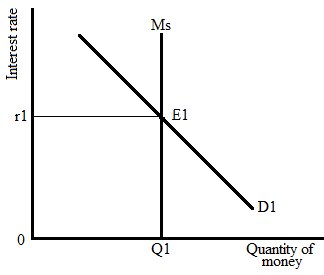
The following graph represents the money market:

Here, curve Ms represents the supply curve, and curve D1 represents the demand curve in the money market. The supply curve is vertical because the supply of money can’t be changed in the short run. The intersection of the
The equilibrium rate of interest is r1.
Q1 is the equilibrium quantity of money.
b)
The question requires us to draw a graph that represents the impacts of an increased price level on the money market.
b)
Explanation of Solution
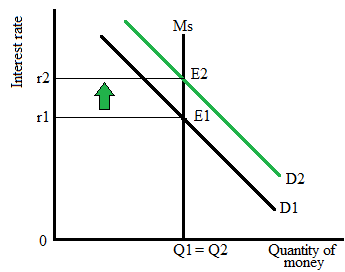
An increase in the general price level will increase the demand for money in the market because a higher price reduces the

Higher demand for money causes the equilibrium to reach point E2 where the new interest rate is r2 which is above the initial rate, and Q2 is the new equilibrium quantity of money.
c)
The question requires us to explain the impact of the new interest rate on real
c)
Explanation of Solution
There is an inverse relationship between the interest rate and the rate of investment.
A higher interest rate reflects higher borrowing costs that disincentivize investors to take loans and make investments in the market or their businesses. Thus, investment in the market will fall.
Similarly, a lower interest rate indicates lower borrowing costs that incentivize the investors to borrow from the loanable fund market, and the investments in the market will increase.
So, an increase in the interest rate from r1 to r2 will decrease the investment in the market.
A lower investment causes the real GDP to fall because a lower investment indicates a lower production capacity in the firms that, in turn, causes the production of goods and services to fall over time and results in a lower real GDP level.
Therefore, the real GDP will decrease when the interest rate rises.
Chapter 5R Solutions
Krugman's Economics For The Ap® Course

 Principles of Economics (12th Edition)EconomicsISBN:9780134078779Author:Karl E. Case, Ray C. Fair, Sharon E. OsterPublisher:PEARSON
 Engineering Economy (17th Edition)EconomicsISBN:9780134870069Author:William G. Sullivan, Elin M. Wicks, C. Patrick KoellingPublisher:PEARSON
 Principles of Economics (MindTap Course List)EconomicsISBN:9781305585126Author:N. Gregory MankiwPublisher:Cengage Learning
 Managerial Economics: A Problem Solving ApproachEconomicsISBN:9781337106665Author:Luke M. Froeb, Brian T. McCann, Michael R. Ward, Mike ShorPublisher:Cengage Learning
 Managerial Economics & Business Strategy (Mcgraw-...EconomicsISBN:9781259290619Author:Michael Baye, Jeff PrincePublisher:McGraw-Hill Education


