
(a)
To draw the budget lines of Mr. J in three different scenarios.
Explanation of Solution
A budget line is a graphical representation of all the possible combinations of goods and services which can be purchased with given income and prices. The total money income of the consumer equals the total cost in purchase of goods and services.
Budget Line is denoted by the equation:
Where,
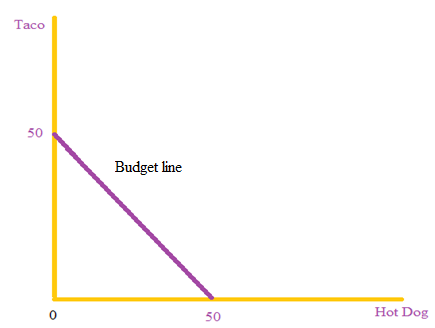
The income of consumer is $100, and the prices of both goods are $2 each. So, the consumer can purchase 50 units of tacos and no hot dogs, 50 units of hot dogs and no tacos or any other feasible combination.
The figure below shows the budget line of this consumer:
(b)
To draw the budget lines of Mr. J in three different scenarios.
Explanation of Solution
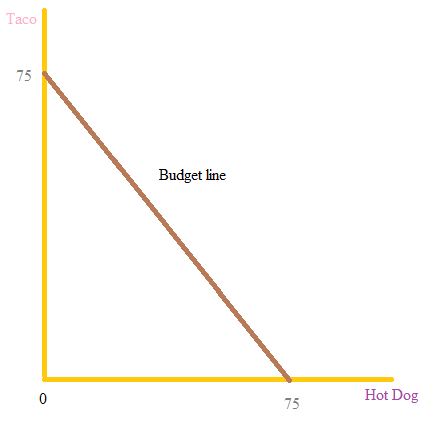
The income of consumer changes to $150 with no change in prices. So, the consumer can now purchase 75 units of either good with no unit of the other good or any other feasible combination.
The figure below shows the budget line of this consumer:
(c)
To draw the budget lines of Mr. J in three different scenarios.
Explanation of Solution
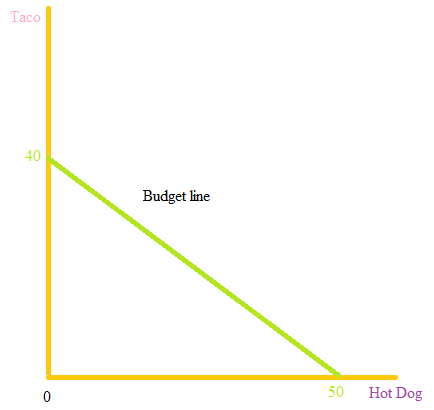
The income of the consumer is $100, and price of tacos is $2.50 per unit whereas the price of hot dogs is $2 per unit.
So, the consumer can either purchase 40 units of tacos and no other good, 50 units of hot dogs and no other goods or any other feasible combination of both.
The figure below shows the budget line of this consumer:
Want to see more full solutions like this?
Chapter 5A Solutions
Microeconomics: Principles and Policy (MindTap Course List)

- Antonio likes to have coffee (C) and donuts (D) for breakfast every morning. He likes to dip his donuts into his coffee, so for every cup of coffee, he eats one and a half donuts. In economic terms, we can say he views one cup of coffee as a perfect complement to one and a half donuts. The price of a cup of coffee is $4.5 and the price of one donut is $2. His budget for breakfast this month is $75. (a) Write down a utility function that represents Antonio's preferences over (cups of) coffee (C) and donuts (D). (There may be many functions representing the same preferences, so you can choose either of them.) (b) How many cups of coffee (C) and donuts (D) is he going to consume? (Hint: the first order conditions will not help; draw the budget constraint and the indifference curves and look at the highest indifference curve that has a point in common with the budget constraint). (c) What is the exact value of Antonio's indirect utility for the utility function you chose in (a)?arrow_forwardAccording to the table, what is the consumer equilibrium for a $6 budget if the price of red peppers is $1 and the price of apricots is also $1?arrow_forwardRaymond consumes meatloaves and pineapples. He has decided that his monthly budget will be $1500. Suppose that one meatloaf costs $375, while one pineapple costs $150. c. Show how Raymond’s budget line changes if the price of pineapples increases to $370. d.. Suppose Raymond decides to cut his monthly budget in half. Coincidentally, the next time he shops, he learns that meatloaves and pineapples are on sale for half price. Show what happens to Raymond’s budget line?arrow_forward
- Suppose that a consumer has an income of $10 per period, and that he must spend it all on meat or potatoes. If meat is $2.00 per pound and potatoes are $2.00 per pound, draw the consumer's budget line on a graph. identify the quantity of meat and potatoes that would be consumed.arrow_forwardScruffie the cat has $15 to spend each month on cat toys, which cost $3 each, and cat treats, which cost $1.50 each. Draw a budget line to show the combinations of each good that Scruffie can afford if she spends her entire budget. Now suppose that cat treats go on sale for $1 each. How does this change in price affect the budget line (describe and show on a graph)?arrow_forwardUse Figure: Budget Lines for Tangerines and Watermelons. For some time, Albert has had $5 per month to spend on tangerines and watermelons. The price of a tangerine is $0.50, and the price of a watermelon is $0.25. Which chart shows what will happen to his budget line if his income increases to $6?arrow_forward
- The price of DVDs (D) is $20.00 and the price of CDs (C) is $10.00. Phillip has a budget of $100.00 to spend on the two goods. Suppose that he has already bought 1 DVD and 1 CD. In addition, there are 3 more DVDs and 7 more CDs that he would really like to buy.The price of DVDs (D) is $20.00 and the price of CDs (C) is $10.00. Phillip has a budget of $100.00 to spend on the two goods. Suppose that he has already bought 1 DVD and 1 CD. In addition, there are 3 more DVDs and 7 more CDs that he would really like to buy. 1.) Using the line drawing tool, given the above prices and income, draw his budget line in the figure.Label this line 'L'. 2.) Using the point drawing tool, and considering what Phillip has already purchased and what he still wants to purchase, identify the three different bundles of CDs and DVDs that he could choose. Label these points 'bundle 1', 'bundle 2', and 'bundle 3'. (Assume that he cannot purchase fractional units) Carefully follow the…arrow_forwardThe table shows Jerry's total utility from lottery tickets and candy bars. The price of a lottery ticket is $2, the price of a candy bar is $4, and Jerry has $12 a week to spend. Calculate Jerry's marginal utility from the fourth lottery ticket and marginal utility per dollar when he buys 4 lottery tickets. Calculate Jerry's marginal utility from the second candy bar and marginal utility per dollar when he buys 2 candy bars >>> Answer to 1 decimal place. ………… Jerry's marginal utility from the fourth lottery ticket is units. The marginal utility per dollar from lottery tickets when Jerry buys 4 lottery tickets is units per dollar. Jerry's marginal utility from the second candy bar is units. The marginal utility per dollar from candy bars when Jerry buys 2 candy bars is units per dollar. C Lottery tickets Total utility 0 14 24 32 38 Quantity per week 0 1 2 3 4 Quantity per week ܘ ܝ ܚ ܚ ܂ 2 3 Candy bars 4 Total utility 0 100 120 134 144arrow_forwardA consumer has income of $3,000. Wine costs $3 per glass, and cheese costs $6 per pound. Make a graph. Draw the consumer’s budget constraint with wine on the vertical axis. Make sure to label the axes.arrow_forward
- Raymond consumes meatloaves and pineapples. He has decided that hismonthly budget will be $1500. Suppose that one meatloaf costs $375, while one pineapple costs $150. i. Draw a graph of Raymond’s budget line (meatloaf on the y axis). ii. Show how Raymond’s budget line changes if the price of pineapplesincreases to $370.arrow_forwardJamani earns a weekly income of $6000. Suppose he wishes to spend this income on two goods, games and DVDs only. A game costs $200 while a DVDcosts $600. Draw Jamani’s budget line. Putting games on the Y axis. ii. Suppose his income increases to $9000 per week, illustrate what happens to her budget line.iii. Suppose the price of games increase to $600, while his income and the price of DVDs is unchanged from part (i).arrow_forwardSuppose Carlos has a budget of $100 to spend on soft drinks and bottled water. Soft drinks cost $2 per liter. Bottled water costs $1 per liter. Draw Carlos's budget line in the graph.arrow_forward


 Economics (MindTap Course List)EconomicsISBN:9781337617383Author:Roger A. ArnoldPublisher:Cengage Learning