
Concept explainers
Videos
To review:
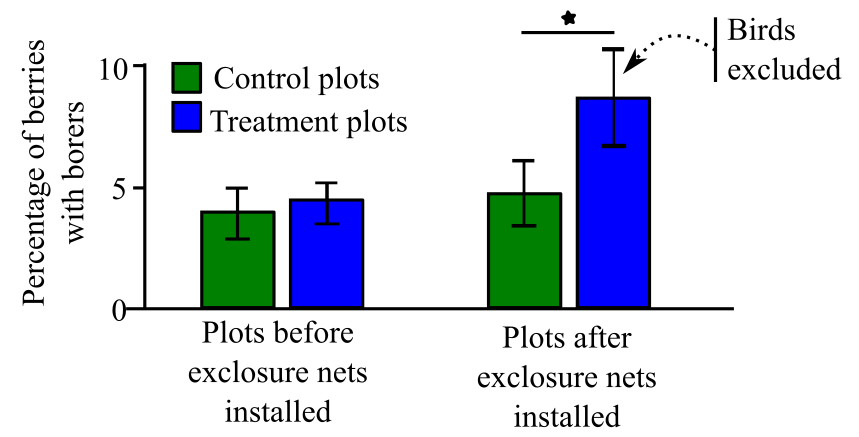
The results of the graph showing the percentage of berries with borers before and after the installation of nets to prevent the intervention of birds.
Introduction:
Borers are beetles or pests that affect the production of coffee berries. They destroy a significant portion of berries crop.
The graph below shows the results of an experiment that was conducted to determine the role of the predatory birds in protecting the coffee plants from the beetles. For this experiment, 12 plots were selected as control where the birds were free to feed on the beetles. The treatment plot was covered with a net to prevent the invasion of the predatory birds. The given study is an attempt to understand whether birds have any role in reducing the number of borers or not.
Want to see the full answer?
Check out a sample textbook solution
Chapter 54 Solutions
Biological Science, Books a la Carte Plus Mastering Biology with Pearson eText -- Access Card Package (6th Edition)


- Give a suitable topic for the following statement: strategies to mitigate greenhouse gas emissions in animal agriculture. Comprehensively discuss only two (2) strategies researchers have developed to help reduce methane emissions, especially from ruminants, in animal agriculture.arrow_forwardGrasses are the dominant producers in the prairie ecosystem. Mice eat the grass seeds, snakes eat the mice, and hawks eat the snakes. The mass of a hawk is around 500 grams. In this ecosystem, how many hawks can be supported by 250,000 kilograms of producers? Recall that 1 kilogram is equivalent to 1,000 grams.arrow_forwardI’m not quite understanding this question can you explain which best describes bottleneck?arrow_forward
- 1. Food irradiation processing delivers doses as high as 5 kGy to eradicate microorganisms from a variety of foods such as fruits, vegetables and meats. Sketch a survival plot assuming that these microorganisms can be described with D, = 4.8 Gy and D, = 1.6 Gy. What is the surviving fraction following a dose of 6.5 Gy? Show the equation you used to construct the plotarrow_forwardBeige and black rabbits were introduced into two meadows. One meadow predominantly consists of volcanic soil and the other predominantly consists of clay soil. Each rabbit was marked with a dot of blue paint and the pad of his foot. The number of rabbits released and recaptured one month later are shown in the table below. Assume the number of rabbits recaptured is a direct reflection of the number of rabbits surviving. Using the data below, what conclusions can you make regarding the color of rabbits and their survival in different soil types? VOLCANIC SOIL # released #recaptures % precentage beige rabbits 137 18 13.1% black rabbits 447 123 27.5% CLAY SOIL # released # recaptures % precentage beige rabbits 393 54 13.1% black rabbits 406 19 4.7%arrow_forwardIndicate YES or NO whether the following are viable alternatives to reduce the environmental impacts of chemical pesticides in agriculture. Group of answer choices The use of polyculture to encourage natural predators of plant pests [ Choose ] NO YES Using a broad-spectrum pesticide that can kill more kinds of pests at once [ Choose ] NO YES Using crop plants that are resistant to herbicides like Round-up (glyphosphate) [ Choose ] NO YES The use of GMO crops that have natural pesticide genes like BT toxin spliced into their DNA [ Choose ] NO YES the use of hormones that prevent pest insects from maturing [ Choose ] NO YES Using pesticides that are persistent and remain in the soil for a long time [ Choose ]…arrow_forward
- 8 р Refer to data from the following graphs and explain why crop rotation has been recommended to farmers rather than using fertilizers (L: low Nitrogen level, H: high Nitrogen level). What could be the potential outcome of using synthetic fertilizers in the ecosystem? Fertilizer Effect Crop Rotation Effect 100 100 • Corn Grain Sorghum 80 80 60 60 40 20 20 • Corn Grain Sorghum 2007 2008 2009 2010 2011 2012 2013 2007 2008 2009 2010 2011 2012 2013 Figure 2. Yield benefits from added fertilizer (average of L and H) decreased over time, but yield benefits increased over time by rotating crops (average across all 2-yr and 4-yr rötations). 12pt v Paragraph v B IU Av ev T? v A singhanmol1012.docx MG5573 Coursew..pdf CBASS-Coursewo..docx CMNS110 Mass.pptx 60°F Partly sunny earch % Yield Difference (160 vs 0 lb N/ac) % Yield Difference (Rotated vs Continuous)arrow_forwardFor a pathogen of interest there is a potential probiotic (the adjacent phase plane diagram depicts the interaction of these two species: orange = pathogen; blue = probiotic). Currently the carrying capacities are K1 competition coefficients are o12 = 0.6, 021 = 0.9 (1 pathogen, 2 probiotic). Which of the following would be a good strategy to make the probiotic more effective at eliminating the pathogen? -550, K2 = 700; and the %3D %3D 1000 800 600 400 200 200 400 600 800 1000 Species 1 (#) ONo further engineering is needed because thereis a steady state point Increase K1 to shift the Nrintercept outfor the pethogen Decrease o12 lo shift the N-Intercept up lor the pathogen (Increase K2 to shift the N intercept up for the probioticarrow_forwardLab 5. Integrated Pest Management (IPM) Go to the following website: http://ipm.ucanr.edu and answer the questions bellow: What is IPM? How does it work? Define: Biological control Cultural controls Mechanical and physical controls Chemical control Describe IPM for one agricultural pest: https://www2.ipm.ucanr.edu/agriculture/, choose a crop, go to Insects and Mites, and choose one insect or mite, then provide with the following information: Name the crop Name and describe a pest Describe the pest damage Describe the pest management including: Biological Control Cultural Control Organically Acceptable Methods Example: http://ipm.ucanr.edu/PMG//r1300611.html Crop Alfalfa Pest Alfalfa Caterpillar Scientific Name: Colias eurytheme Description of the Pest The yellow or white butterflies of the alfalfa caterpillar lay eggs on the new growth of alfalfa that is less than 6 inches tall. Eggs hatch into green caterpillars in 3 to 7 days. Full-grown…arrow_forward
- The three microbial species shown in the graph where all treated at 70° C. When we have to sterilize a food product that contained 107 bacteria, the time taken for each bacterial species would be:- For species A :- 42 minutes For species B :- 70 minutes For species C :- 112 minutes arrow_forward Step 3 The D70 values for these three bacterial populations. D70 for microbial species A= 42 minutes B: D70 microbial species B= 70 minutes C: D70 microbial species C =112 minutes Please answer these questions below: please use drawings too (i learn best that way) For the next three questions, assume D90 = 22 minutes. At what temperature will you treat a food product? How long does it take you to kill 90% of bacteria? How long will it take you to sterilize a food product if it had 109 bacteria on it?arrow_forwardAre the below statements true or false (correct or wrong)? You have briefly to motivate your answer using graphs and/or arguments. a) A specific forest area is discovered to be an important habitat for a certain variety of snakes. Thus, the optimal timber rotation time should be extended. b) Assume a mine extracting both copper and silver. If the price of copper falls and the mine managers decides to increase the production of silver, silver then represents a socalled by-product. c) A rise in global demand for copper will shorten the reserve life of a given copper mining operation. d) If a farm grows two different crops and the price of one of the crops increases, the production mix will shift towards reduced production of the crop that has become more expensive.arrow_forwardA) What is the independent variable? What is the dependent variable? B)In what type of environment would you most likely find Fish Species 1 In what type of environment would you most likely find Fish Species 2 C)How much oxygen is consumed by Fish Species 1 when the salinity is 10 ppt? Fish Species 2 will consume 6 mg/min of oxygen at what salinityarrow_forward
