Concept explainers
(a)
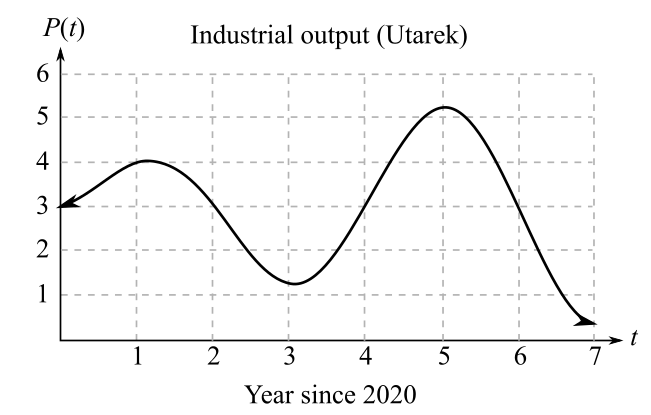
The nearest year in which the rate of change of yearly industrial output reaches a maximum where the graph shows the yearly industrial output (measured in billions of Zonars) of the city-state of Utarek on mars over

(b)
The nearest year in which the rate of change of yearly industrial output reaches a minimum where the graph shows the yearly industrial output (measured in billions of Zonars) of the city-state of Utarek on mars over

(c)
The nearest year in which the graph first change from concave up to concave down and the correct option from the options about the result a) in that year the rate of change of industrial output reached a minimum compared to the nearby years b) in that year the rate of change of industrial output reached a maximum compared to the nearby years; where the graph shows the yearly industrial output (measured in billions of Zonars) of the city-state of Utarek on mars over

Want to see the full answer?
Check out a sample textbook solution
Chapter 5 Solutions
WebAssign Printed Access Card for Waner/Costenoble's Applied Calculus, 7th Edition, Single-Term
- Table 6 shows the population, in thousands, of harbor seals in the Wadden Sea over the years 1997 to 2012. a. Let x represent time in years starting with x=0 for the year 1997. Let y represent the number of seals in thousands. Use logistic regression to fit a model to these data. b. Use the model to predict the seal population for the year 2020. c. To the nearest whole number, what is the limiting value of this model?arrow_forwardThe half-life of plutonium-244 is 80,000,000 years. Find function gives the amount of carbon-14 remaining as a function of time, measured in years.arrow_forwardTable 2 shows a recent graduate’s credit card balance each month after graduation. a. Use exponential regression to fit a model to these data. b. If spending continues at this rate, what will the graduate’s credit card debt be one year after graduating?arrow_forward
- The fox population in a certain region has an annualgrowth rate of 9 per year. In the year 2012, therewere 23,900 fox counted in the area. What is the foxpopulation predicted to be in the year 2020 ?arrow_forwardCan the average rate of change of a function be constant?arrow_forwardDefine Newton’s Law of Cooling. Then name at least three real-world situations where Newton’s Law of Cooling would be applied.arrow_forward
- Use the table of values you made in part 4 of the example to find the limiting value of the average rate of change in velocity.arrow_forwardDuring a nine-hour snowstorm, it snows at a rate of 1 inch per hour for the first 2 hours, at a rate of 2 inches per hour for the next 6 hours, and at a rate of 0.5 inch per hour for the final hour. Write and graph a piecewise-defined function that gives the depth of the snow during the snowstorm. How many inches of snow accumulated from the storm?arrow_forward
 Algebra & Trigonometry with Analytic GeometryAlgebraISBN:9781133382119Author:SwokowskiPublisher:Cengage
 Trigonometry (MindTap Course List)TrigonometryISBN:9781337278461Author:Ron LarsonPublisher:Cengage Learning
 Functions and Change: A Modeling Approach to Coll...AlgebraISBN:9781337111348Author:Bruce Crauder, Benny Evans, Alan NoellPublisher:Cengage Learning
 College Algebra (MindTap Course List)AlgebraISBN:9781305652231Author:R. David Gustafson, Jeff HughesPublisher:Cengage Learning


